


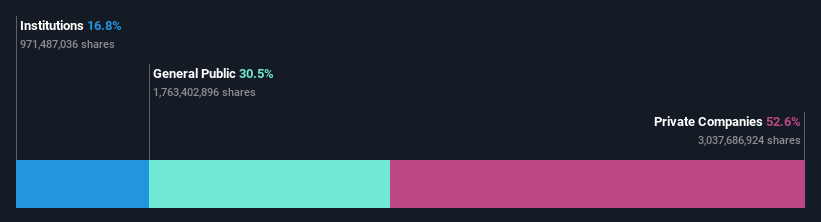
To get a sense of who is truly in control of SMU S.A. (SNSE:SMU), it is important to understand the ownership structure of the business. And the group that holds the biggest piece of the pie are private companies with 53% ownership. In other words, the group stands to gain the most (or lose the most) from their investment into the company.
As a result, private companies collectively scored the highest last week as the company hit CL$623b market cap following a 15% gain in the stock.
Let’s delve deeper into each type of owner of SMU, beginning with the chart below.
However if you’d rather see where the opportunities and risks are within SMU’s industry, you can check out our analysis on the XX Consumer Retailing industry.
What Does The Institutional Ownership Tell Us About SMU?
Many institutions measure their performance against an index that approximates the local market. So they usually pay more attention to companies that are included in major indices.
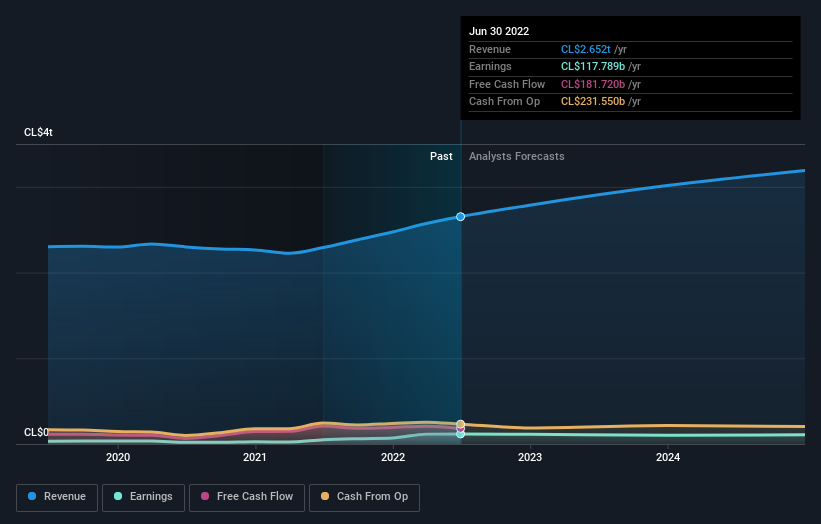
As you can see, institutional investors have a fair amount of stake in SMU. This suggests some credibility amongst professional investors. But we can’t rely on that fact alone since institutions make bad investments sometimes, just like everyone does. When multiple institutions own a stock, there’s always a risk that they are in a ‘crowded trade’. When such a trade goes wrong, multiple parties may compete to sell stock fast. This risk is higher in a company without a history of growth. You can see SMU’s historic earnings and revenue below, but keep in mind there’s always more to the story.
SMU is not owned by hedge funds. Inversiones Sams SPA is currently the largest shareholder, with 23% of shares outstanding. In comparison, the second and third largest shareholders hold about 17% and 4.9% of the stock.
To make our study more interesting, we found that the top 5 shareholders control more than half of the company which implies that this group has considerable sway over the company’s decision-making.
Researching institutional ownership is a good way to gauge and filter a stock’s expected performance. The same can be achieved by studying analyst sentiments. While there is some analyst coverage, the company is probably not widely covered. So it could gain more attention, down the track.
Insider Ownership Of SMU
The definition of company insiders can be subjective and does vary between jurisdictions. Our data reflects individual insiders, capturing board members at the very least. Company management run the business, but the CEO will answer to the board, even if he or she is a member of it.
Insider ownership is positive when it signals leadership are thinking like the true owners of the company. However, high insider ownership can also give immense power to a small group within the company. This can be negative in some circumstances.
We note our data does not show any board members holding shares, personally. Given we are not picking up on insider ownership, we may have missing data. Therefore, it would be interesting to assess the CEO compensation and tenure, here.
General Public Ownership
With a 31% ownership, the general public, mostly comprising of individual investors, have some degree of sway over SMU. While this group can’t necessarily call the shots, it can certainly have a real influence on how the company is run.
Private Company Ownership
It seems that Private Companies own 53%, of the SMU stock. It’s hard to draw any conclusions from this fact alone, so its worth looking into who owns those private companies. Sometimes insiders or other related parties have an interest in shares in a public company through a separate private company.
Next Steps:
While it is well worth considering the different groups that own a company, there are other factors that are even more important. Case in point: We’ve spotted 3 warning signs for SMU you should be aware of, and 1 of them is a bit unpleasant.
But ultimately it is the future, not the past, that will determine how well the owners of this business will do. Therefore we think it advisable to take a look at this free report showing whether analysts are predicting a brighter future.
NB: Figures in this article are calculated using data from the last twelve months, which refer to the 12-month period ending on the last date of the month the financial statement is dated. This may not be consistent with full year annual report figures.
Have feedback on this article? Concerned about the content? Get in touch with us directly. Alternatively, email editorial-team (at) simplywallst.com.
This article by Simply Wall St is general in nature. We provide commentary based on historical data and analyst forecasts only using an unbiased methodology and our articles are not intended to be financial advice. It does not constitute a recommendation to buy or sell any stock, and does not take account of your objectives, or your financial situation. We aim to bring you long-term focused analysis driven by fundamental data. Note that our analysis may not factor in the latest price-sensitive company announcements or qualitative material. Simply Wall St has no position in any stocks mentioned.
Discounted cash flow calculation for every stock
Simply Wall St does a detailed discounted cash flow calculation every 6 hours for every stock on the market, so if you want to find the intrinsic value of any company just search here. It’s FREE.
Read More: Private companies in SMU S.A. (SNSE:SMU) are its biggest bettors, and their bets paid off


