


The Market
My work says we’ll be back to a slight, short-term overbought condition by Friday. When the
market has chopped as much as it has in the last three weeks, it is hard to get a good
oversold or a good overbought, which is why I use the term slight.
Of course I always find the timing interesting, since on Friday we will get the monthly
employment report, which can be quite market-moving. Except, I would also consider that the
Fed minutes were out today and it was pretty clear the Fed is still hawkish, and yet the
market tried to go down and couldn’t. This chop-fest makes it hard to have a decent move in
the index.
But let’s talk market internals. Breadth was once again good. That means for
three of the last four trading days, breadth has been positive by a decent amount. The one
day it was negative was by a small amount. When we look at the chart of the S&P with
cumulative breadth, we can see it better. The blue line (breadth) is now at the equivalent
of 3950 on the S&P (brown line). As I have said countless times before, when the mega-cap
stocks don’t participate, it leaves money to go into other stocks.
The better breadth has in turn helped the McClellan Summation Index turn upward. This, too,
is a positive.
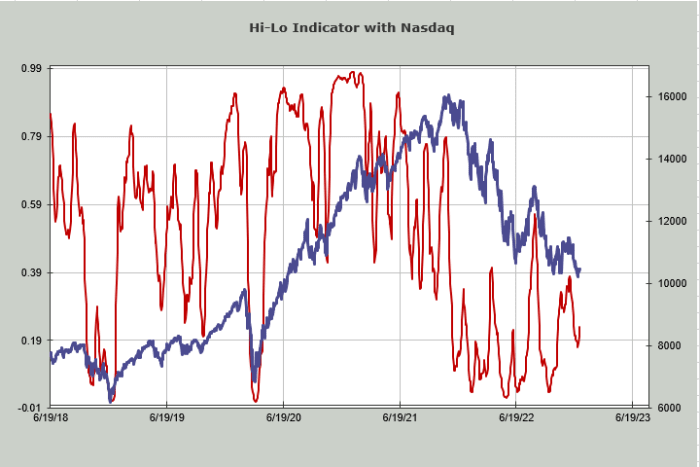
Last night we discussed the 10-day moving average of new lows for Nasdaq and how they have
been contracting. Now we can see that influence on the Hi-Lo Indicator for Nasdaq, as it
turned up from .18 late last week, which is a higher low than the prior low.
Sentiment-wise, the Daily Sentiment Index for Nasdaq is at 16 and the S&P is at 19, so even
if we sell off (on the employment number?) these would show too much bearishness once
again. If the S&P can get up and over 3900, it might lift some of the gloom.
New Ideas
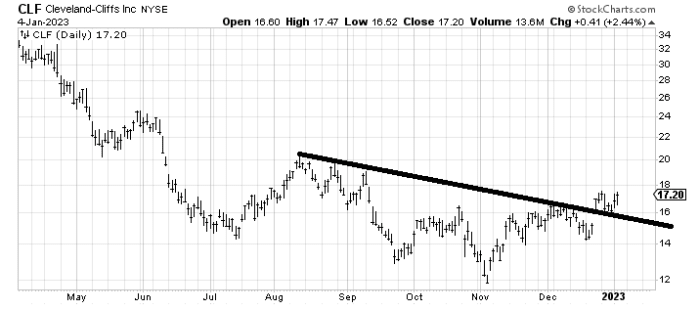
I want to revisit the chart of Cleveland-Cliffs (CLF) – Get Free Report, which we looked at a few weeks
ago, when it popped over that downtrend line. I wanted it to pullback to test the line and
it has. Now, as long as it stays over $15.50, it should work its way higher.
Today’s Indicator
The Volume Indicator is at 49%. Not quite oversold.
Q&A/Reader’s Feedback
Helene welcomes your questions about Top Stocks and her charting strategy and
techniques. Please send an email directly to Helene with your questions. However, please
remember that TheStreet.com Top Stocks is not intended to provide personalized investment
advice. Email Helene here.
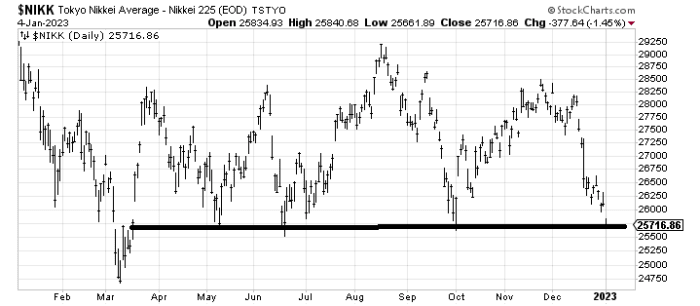
The chart of the Nikkei is not a pretty one. In fact the only good thing one can say about
it is that it is down near support, if not at it. Yet the DSI for the Nikkei is now at 25,
having tagged 20 just a few days ago, which tells me if this does break this support then
the DSI is going to tell us it’s a buy. I would love to see more chatter here in the U.S.
over it and that might only occur if it breaks down. They have one more holiday in January
(Jan. 10) so we should watch as we get near that date.
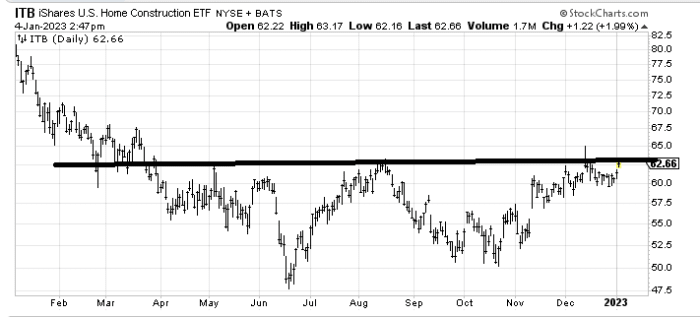
We looked at Toll Brothers (TOL) – Get Free Report recently, just before this last pullback with a
positive eye (I believe my comment was it needs some more work). The iShares U.S. Home
Construction ETF (ITB) – Get Free Report chart is similar. It’s not as though crossing this line will be
a superior breakout because you can see all that resistance on the left side of the chart
but as long as this stays over $58-$60 I am inclined to think it works its way higher.
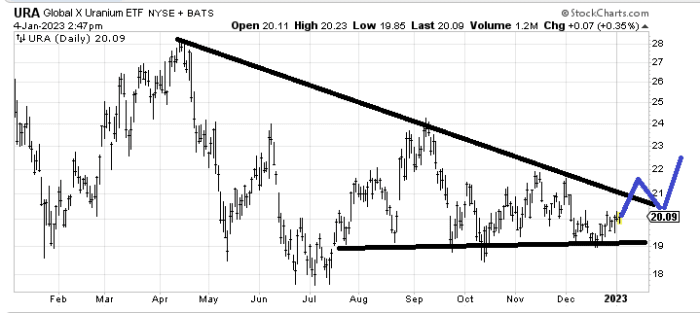
Global X Uranium ETF (URA) – Get Free Report looks like it has no life. I would like to see some more
life in the chart. For example, if it mapped out as I have drawn in blue, it would show me
there is some life in the chart.
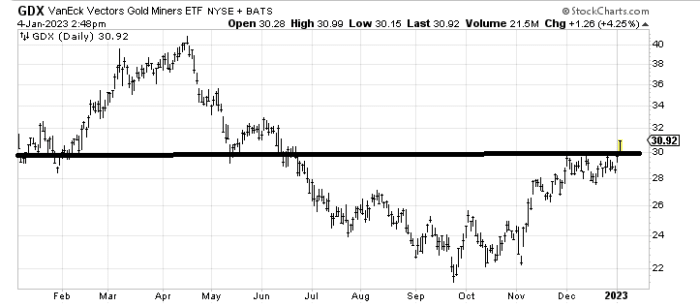
VanEck Gold Miners ETF (GDX) – Get Free Report has had a nice breakout, but still has resistance all the
way up. I have a near-term target around $32 (there is also some resistance there). Longer
term, it ought to measure near the old high. I am not a fan of chasing in this market
though. I’d rather see it rally to $32 and then buy the dip to $30.
Read More: A Tough Job: Getting Overbought


