


sonatali/iStock Editorial via Getty Images
Despite its operational resilience and the quality of its portfolio, Citycon Oyj (OTCPK:COYJF) is still trading at a 23% discount from its price in early 2020. Citycon’s management is determined to close the 40% gap between its stock price and the company’s net asset value, by repurchasing shares and realizing the existing building rights. Hence, investors have the opportunity to acquire a quality real estate portfolio with a sweet upside potential.
Background information
Citycon Oyj (Citycon thereafter) is a real estate company founded in 1988 and operating in the Nordic and Baltic regions. The company is headquartered in Espoo (Finland) and has 233 employees. Citycon’s business model is centered on the active management and development of a portfolio of grocery-anchored community centers in major urban hubs. The company is not operating under a REIT-like regime, which allows for more flexibility in operations and earning reinvestment choices.
Citycon’s portfolio is composed of 39 properties valued at €4.46 bln. (third-party valuation by CBRE and JLL), including 37 shopping centers (€4.16 bln.) and one retail JV investment (€0.25 bln.). This represents a gross leasable area of 1,190 thousand square meters (sqm), with a solid occupancy rate of 94% and a weighted-average lease term (WALT) of 3.2 years, as of Q3 2021. The properties are located in Finland & Estonia (~43% of portfolio value), Norway (~34%) and Sweden (~23%).
Overview of financials
Citycon’s portfolio is generating a gross rental income (GRI) of €304 mln., a net operating income (NOI) of €209 mln. and funds from operations (FFO) of €104 mln., over the last 12 months (LTM) until Q3 2021 (including the proportionate share of its JV). The dividend policy consists in distributing 50% of the company’s normalized net income (i.e., net income after removing the changes in properties’ fair value). This results in a 7.0% dividend yield on the current stock price.
From FY 2016 to FY 2019, Citycon’s rental income was very stable around €290 per sqm, despite the difficulties experienced by the retail real estate sector in most developed countries. During the first year of the pandemic (FY 2020), the rental income fell at €247 per sqm (-17.4% year-over-year). However, over the LTM ending Q3 2021, the company presented a rental income of €255 per sqm, which seems to indicate that the situation has stabilized.
Interestingly, the NOI stayed remarkedly stable in percentage of the rental income (69.5% during FY 2020 and 68.8% for LTM Q3 2021, against an average of 69.1% from FY 2016 to FY 2019), attesting to the company’s ability to reduce its operational expenses. Citycon’s funds from operations (FFO) was also quite robust during the pandemic, most notably as a percentage of the rental income.
Created by author using company financials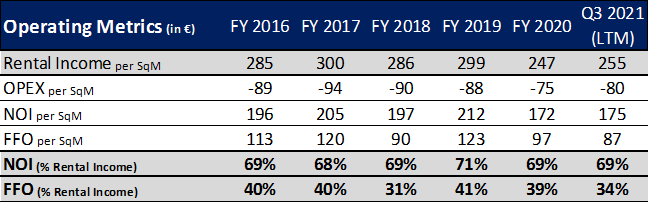
Citycon’s stock trades at €7.13 per share, at market close on January 10, 2022. This price is 23% under the prices in early 2020 (i.e., before the Covid-19 crisis), which averaged roughly €9.30. The stock traded as low as €5.30 during the crisis (43% drawdown), which implies a recovery of 35% since then. This can be put in perspective with Citycon’s EPRA NRV which falls by 5.7% from €12.3 per share (Q4 2019) to €11.6 per share (Q3 2021).
With a market capitalization of about €1.2 bln., the current stock price implies an FFO multiple of roughly 11.5x and an implied capitalization rate of 6.9%. This market-implied capitalization rate compares very favorably with the capitalization rate determined by the third-party valuers (at 5.4% based on company’s disclosure), resulting in a 149 basis points (bps) spread. Note that the public-private capitalization rates spread has materially widen, from FY 2016 to Q3 2021 (from 38 bps to 149 bps). This means that listed market investors are far more pessimistic than appraisers regarding Citycon’s properties’ fair value.
Created by author using company financials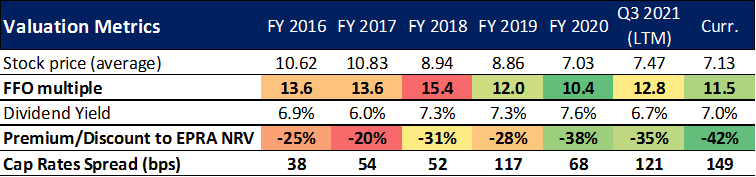
Note 1: The numbers in the column “Curr.” are computed using the current stock price of €7.13 (10-Jan-2022) and company financials over the LTM ending Q3 2021. The other columns use the average stock price over the period and the company financials over the corresponding period.
Note 2: Cap Rates Spread (bps) is the difference between the capitalization rate which is implied in the stock price and the weighted-average capitalization rate used by the third-party appraisers to value the company’s properties (as disclosed in their financial reports). As such, this is a measure of the discrepancy between the private and the public markets’ perceptions of the fair value of Citycon’s assets.
Investment Thesis
The following table summarizes the key points should be considered when analyzing Citycon.
Author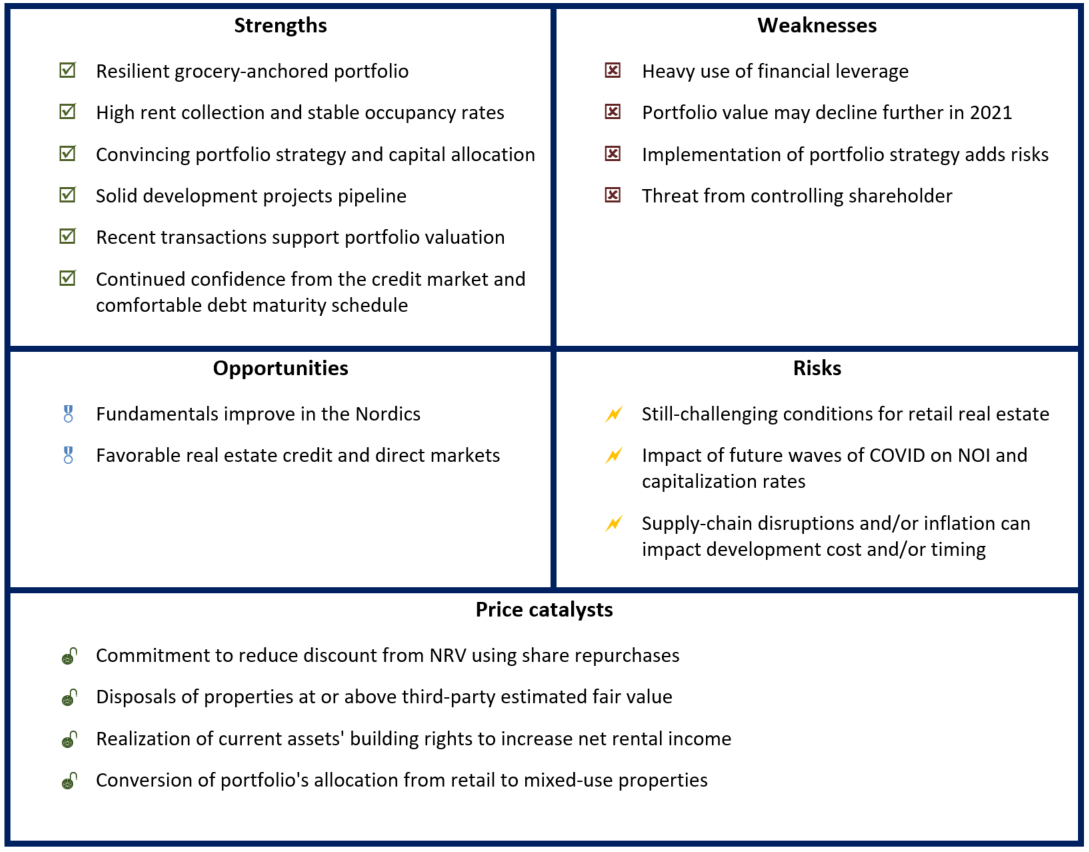
Strengths
Resilient grocery-anchored portfolio
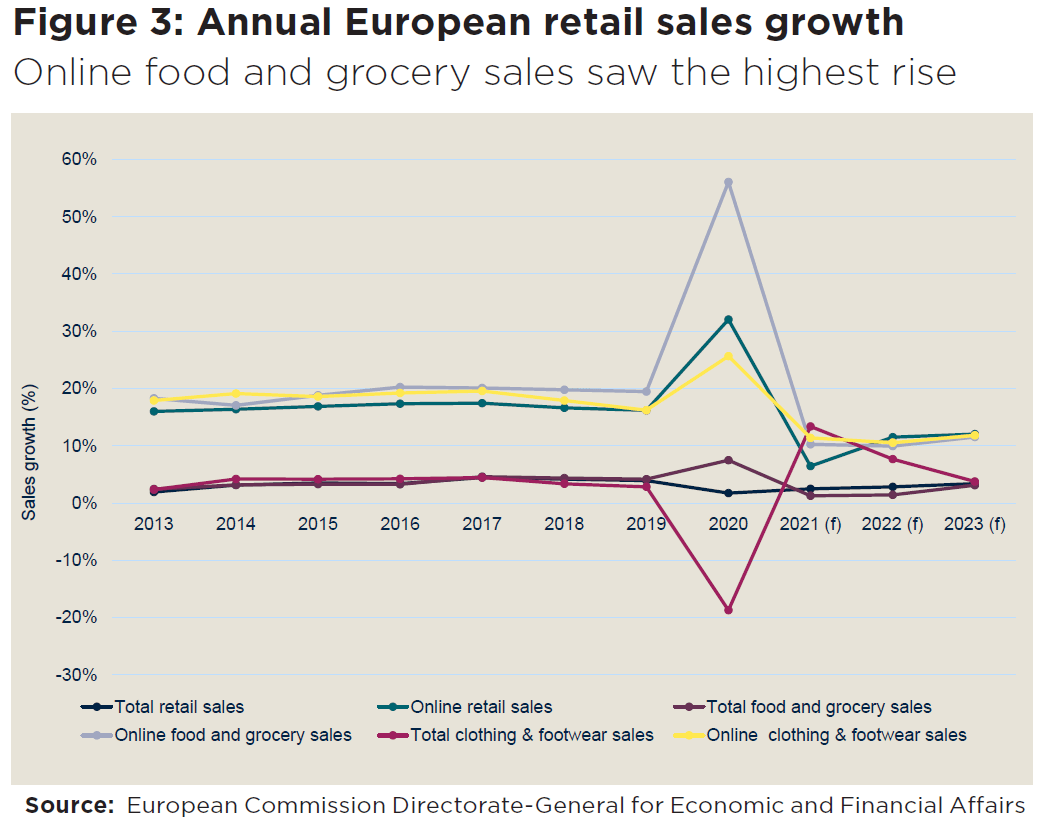
Groceries and other necessity-based retail (e.g., health care, dentists, pharmacies, etc…) are well known to be more resilient to change in consumers’ demand, notably during periods of economic stress. The Covid-19 crisis provided a perfect example of the resilience of grocery sales. As can be seen on the figure below, food and grocery sales were not much impacted in Europe, during the Covid-19 crisis.
As of Q3 2021, grocery and necessity shopping represented roughly 37% of the total gross rental income of Citycon. This helped to maintain footfall (i.e., consumers’ traffic) and tenants’ sales in the company’s shopping centers. Moreover, footfall has a positive spillover effect on the other tenants which provide non-necessity goods or services (e.g., fashion retailers), as it drives potential consumers in centers. Service and office surfaces are also stable sources of rental income (14% of GRI).
Citycon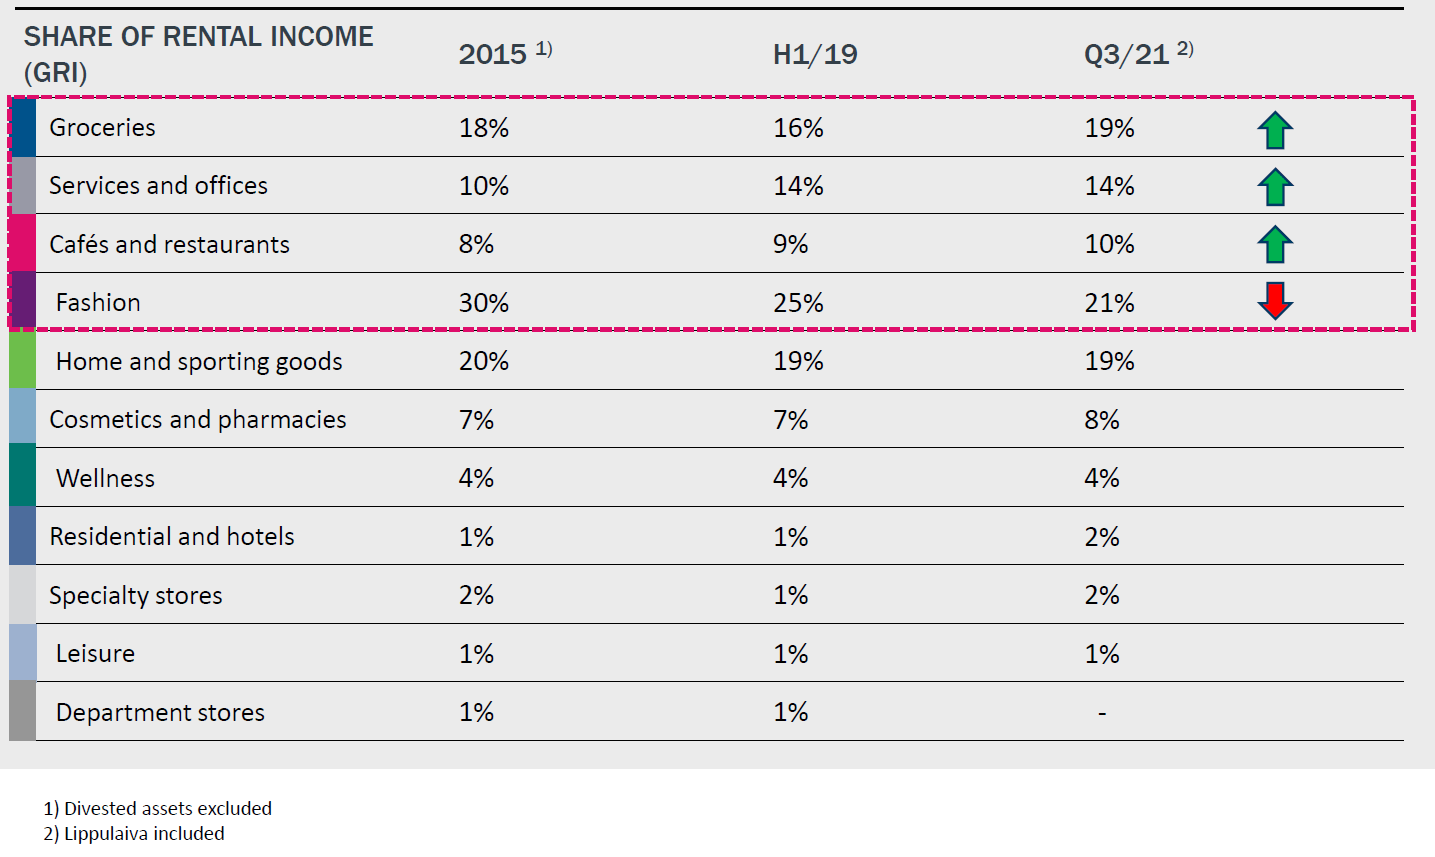
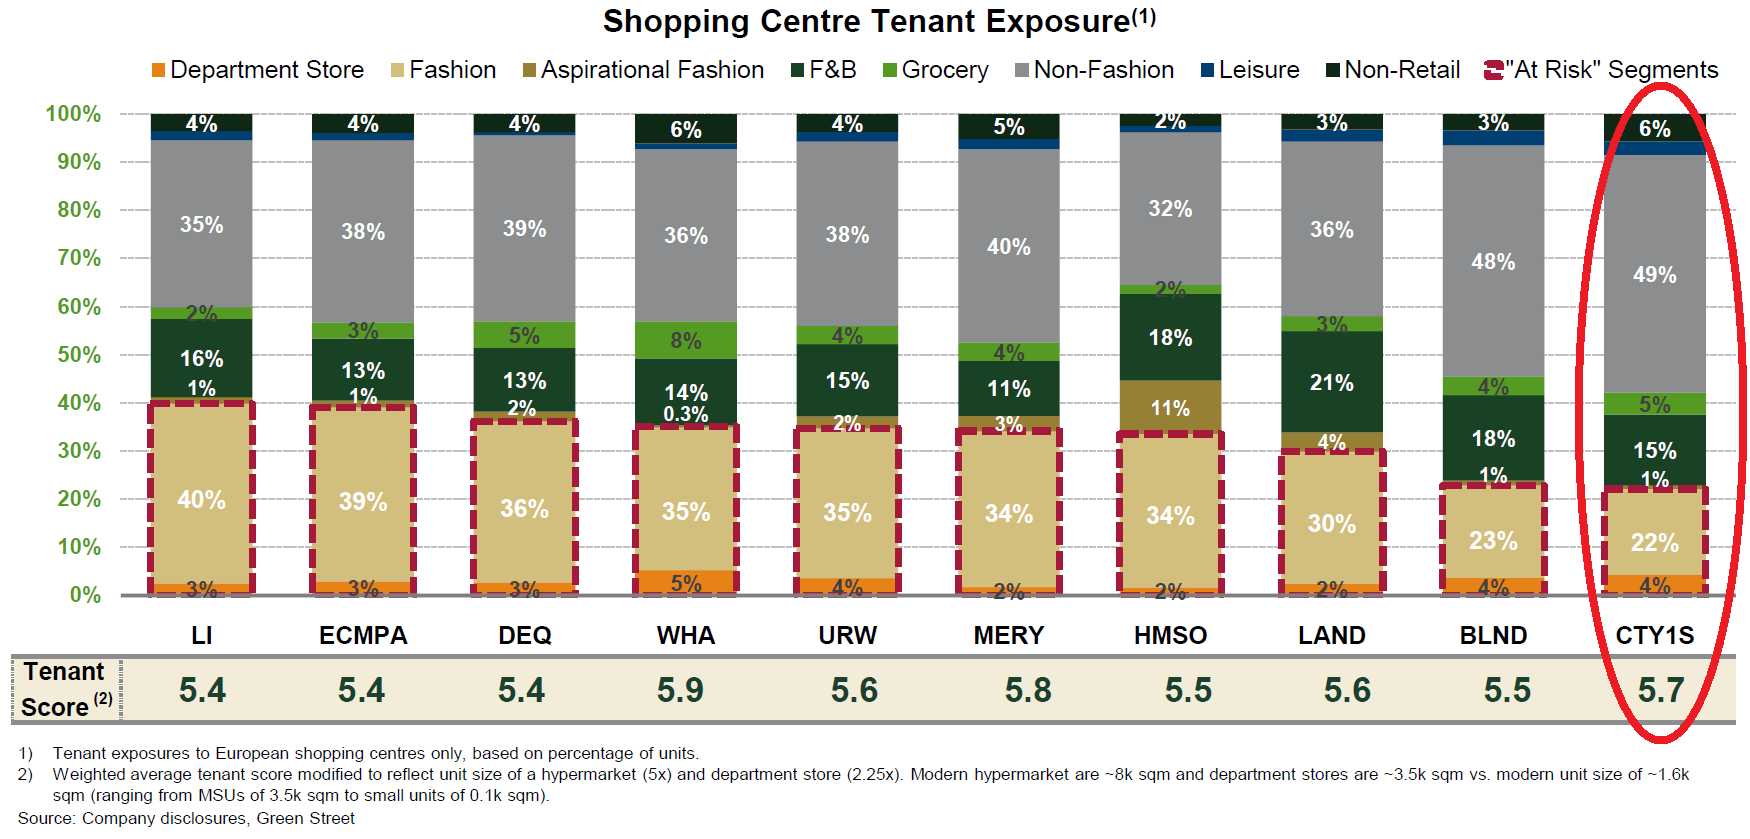
This orientation toward necessity-based retail combined with the fact that Citycon’s properties are well connected to public transportation networks contribute to stabilizing the company’s rental income. Importantly, this strategic orientation results from a still-ongoing effort by the management to minimize operational risk. As a result of this strategy, Citycon presents less rental income risk than its peers, as can be seen on the figure below. GreenStreet Advisors have found that Citycon has the lower exposures to “at-risk” segments among its European peers (based on rental units instead of GRI).
Grocery and other necessity-based tenants provide also advantages in terms of leasing. In comparison with fashion, grocery and necessity-based leases are generally longer and with a higher probability of prolongation, despite the fact that rents per sqm are at comparable levels. For groceries in particular, tenant’s credit risk is generally lower than for fashion, due to more stable revenues. Grocery shops also use bigger and less desirable areas, which help keep vacancy low. All these elements contribute greatly to stabilize the NOI of grocery-anchored properties. Note also that 92% of Citicon’s rental income is indexed to CPI, which provides protection against inflation.
Citycon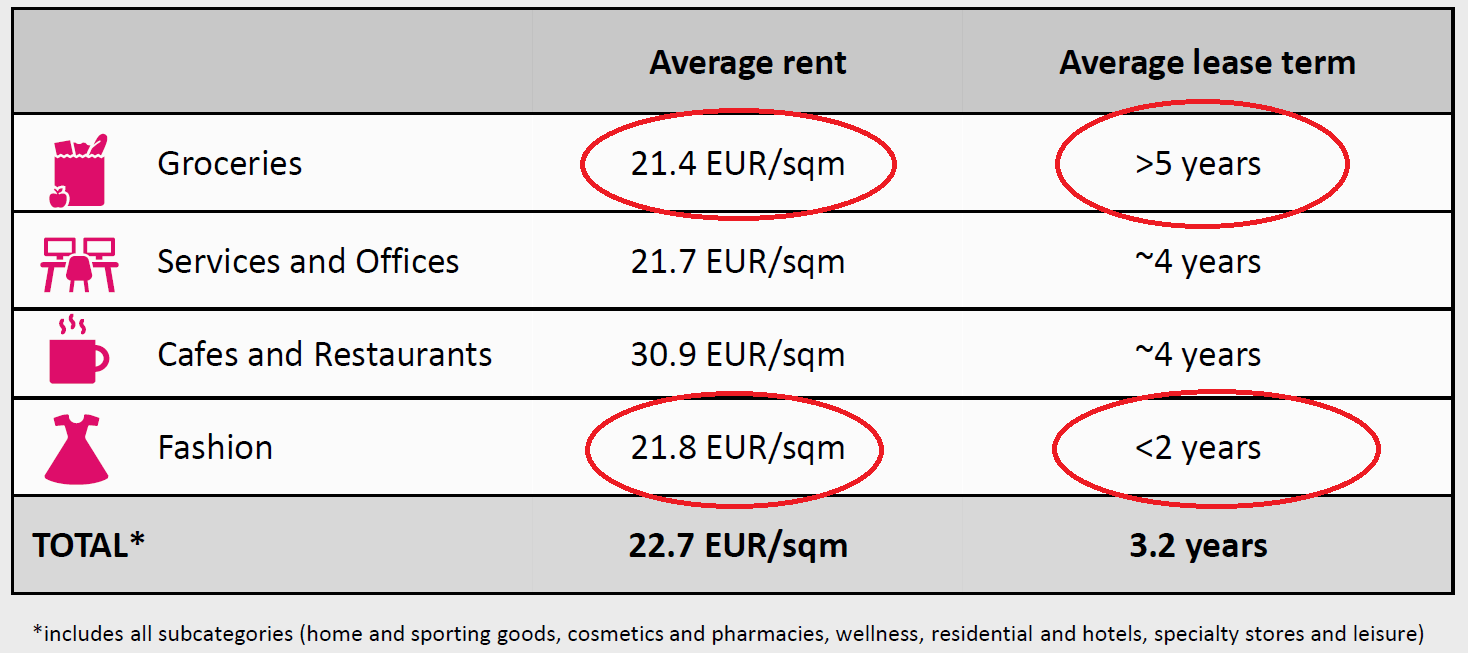
These advantages in comparison with fashion-oriented retail properties push investors to increasingly consider the food and grocery sector as the new core segment for retail real estate. According to Savills Research, this results in high return potential and limited risk, for this sector.
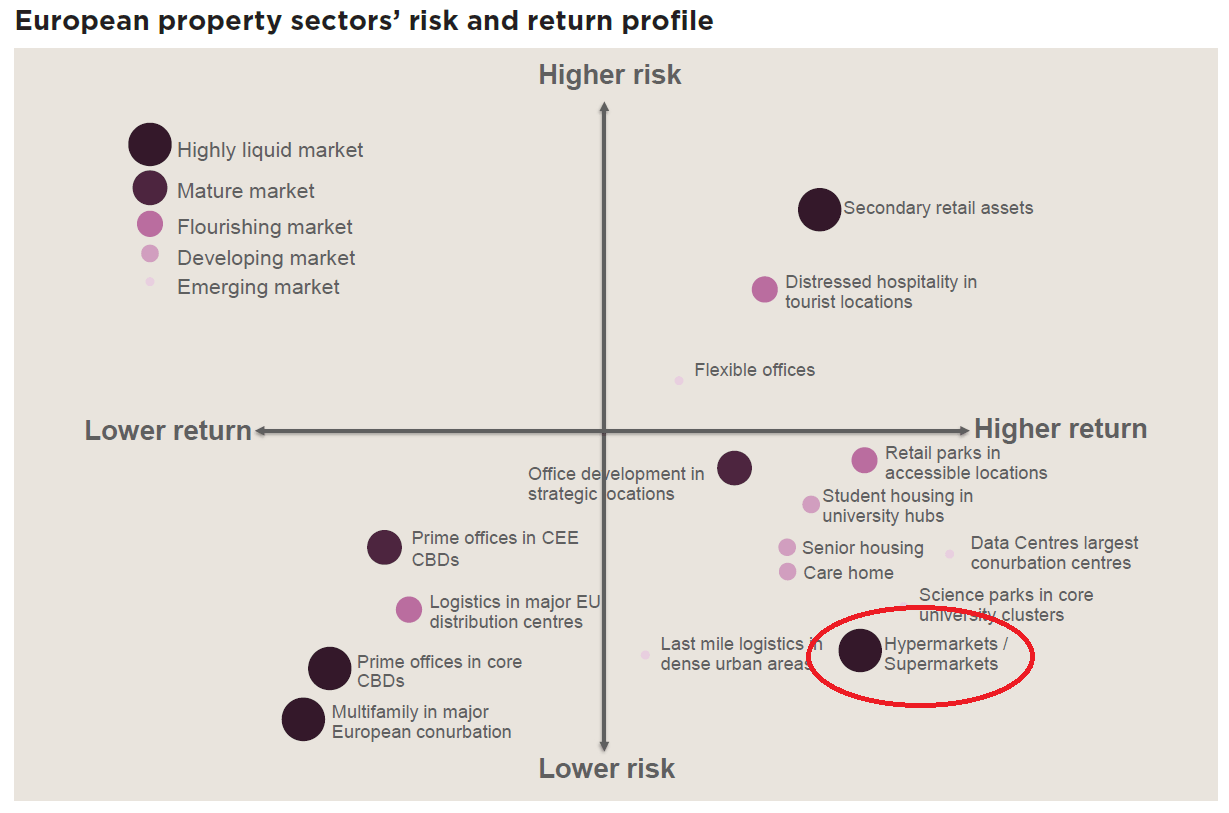
This perceived lower risk is generally translated in property valuations. On the U.S. market, Real Estate Investment Trusts (REITs) with grocery-anchored assets command a valuation premium of roughly 80 bps over other retail REITs (i.e., Citycon’s assets can be classified as grocery-anchored community centers).
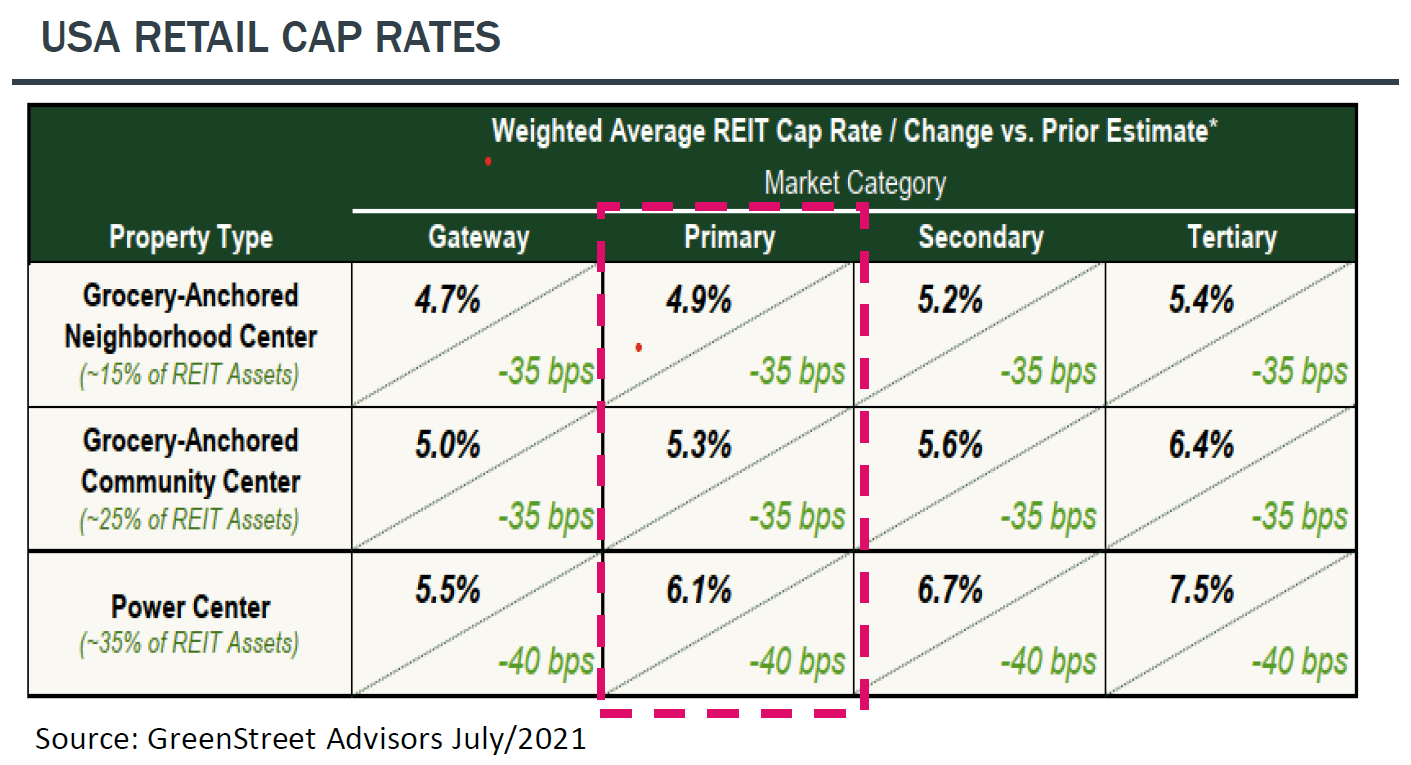
This premium is also generally present on the European direct market, where grocery-anchored properties present cap rates in line with the ones of prime centers (~100 bps under second class centers). On the European listed real estate market, the lower cash-flow risk of grocery-anchored assets is not priced. This puts Citycon at a relative pricing advantage in comparison with some of its peers.
High rent collection and stable occupancy rates
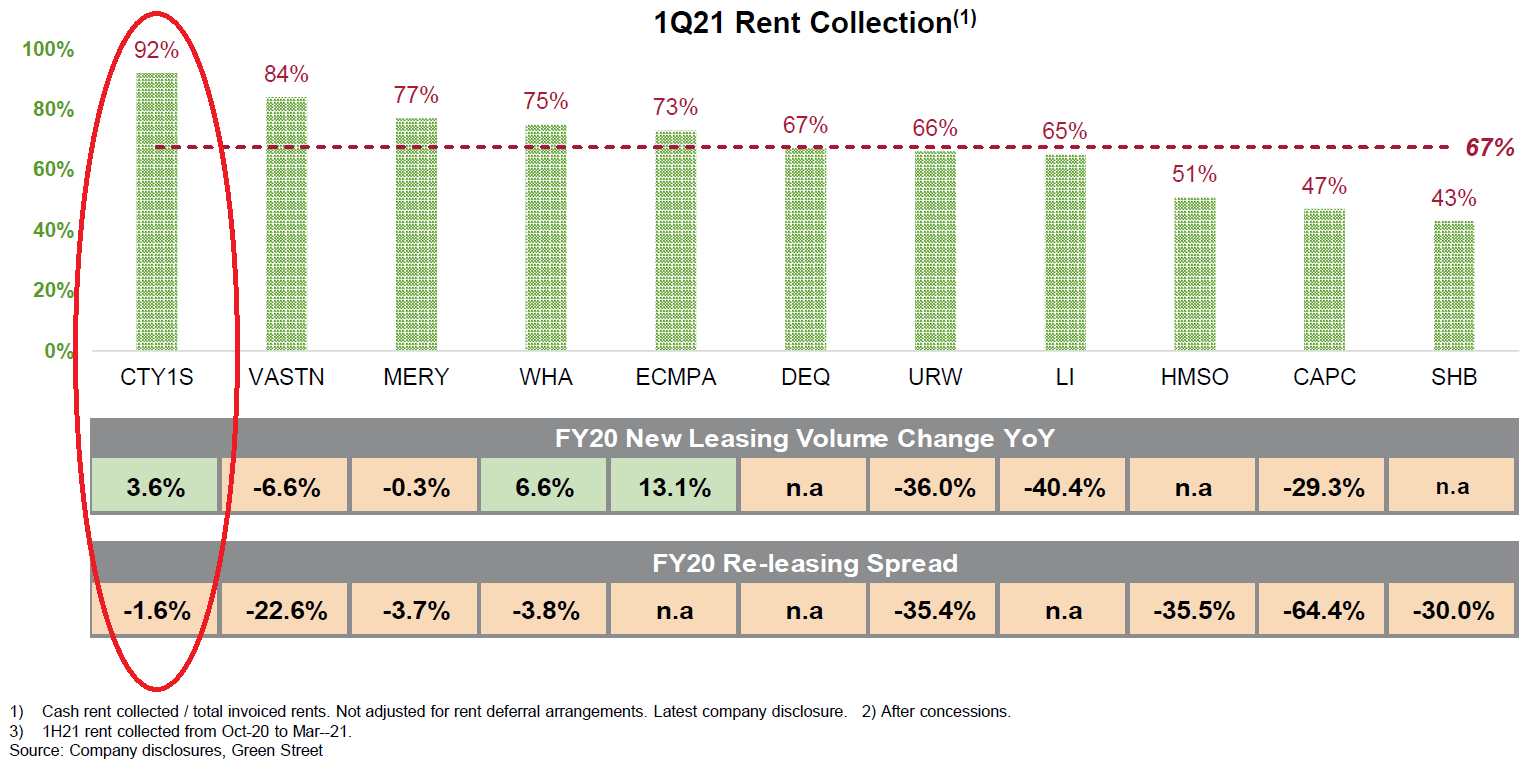
Citycon’s focus on stable retail properties has permitted to stabilize its rent collection and occupancy rates over time and, notably, through the pandemic. As such, its rent collection compares very favorably with its peers (consistently over 90% since FY 2016). As can be observed in the figure below, Citycon’s new leasing volume and re-leasing spread are comparatively stronger than its peers, during FY 2020. These numbers mean that Citycon was able to carry on with their leasing activity without conceding substantial discount on leases. This testifies to the strong demand for Citycon’s surfaces.
Before the Covid-19 crisis, occupancy rates were consistently in a very narrow range from 95% to 97%, since FY 2016. The pandemic had only a moderate impact on occupancy, which dropped to around to 93.5%. A level which is still very comfortable (peers’ occupancy rates were under 90%). This has reflected positively on Citycon’s quarterly NOI per sqm which fluctuates between €44 to €50 and €40 to €44, before and during the pandemic, respectively (excluding Kista Galleria JV).
Created by author using company financials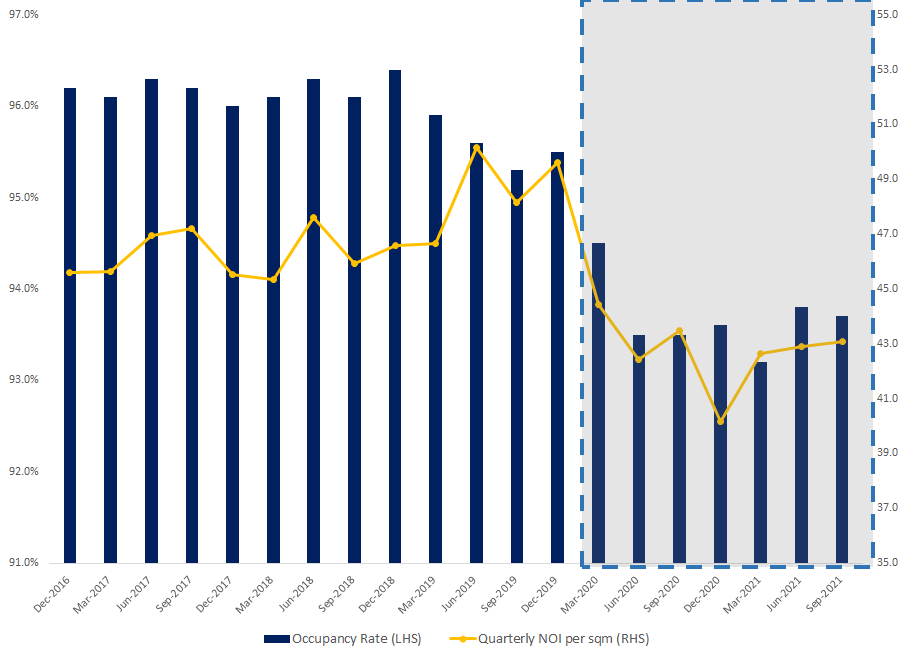
The business-friendly management of the pandemic in the Nordics (i.e., comprehensive support for tenants and less severe lock-downs than other European countries) helped to keep rental relief granted to tenants at a very low level of €5.2 mln., since the beginning of the pandemic (~1.8% of annual GRI). The total adverse impact of the Covid-19 on net rental income (i.e., rental relief, credit losses and loss of volume-driven income, such as parking) is estimated at €13.5 mln. and €5 mln. in 2020 and 2021, respectively.
The softer approach taken by Nordic…
Read More: Citycon: The Future (Of Retail Real Estate) Is Now, Old Man (OTCMKTS:COYJF)


