


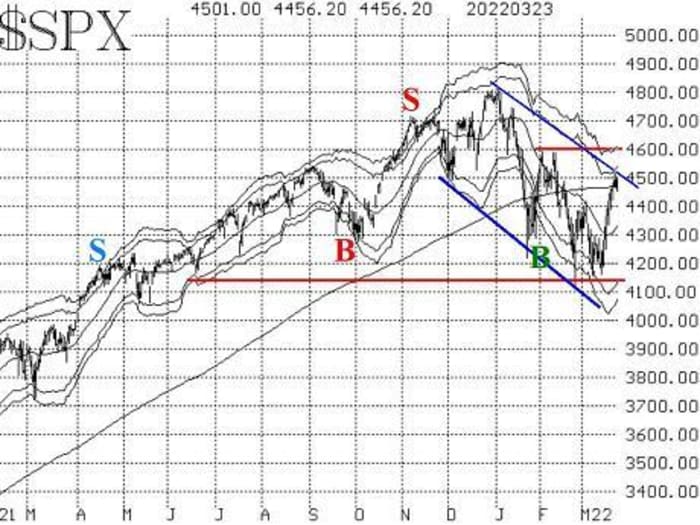
The S&P 500 index stretched its oversold rally about as far as it could. The question still remains as to whether it is just an oversold rally or the beginning of a new bull-market phase.
As we’ve said many times, oversold rallies typically die just above the declining 20-day moving average. This one has slightly exceeded its 20-day MA and bumped into its 200-day moving average. In doing so, it broke though the downtrend line that had been in force.
In my opinion, though, that is not significant. What would be significant would be a close above 4600. Lacking that, the S&P
SPX,
chart is still bearish and that still warrants holding a “core” bearish position.
Lawrence McMillan
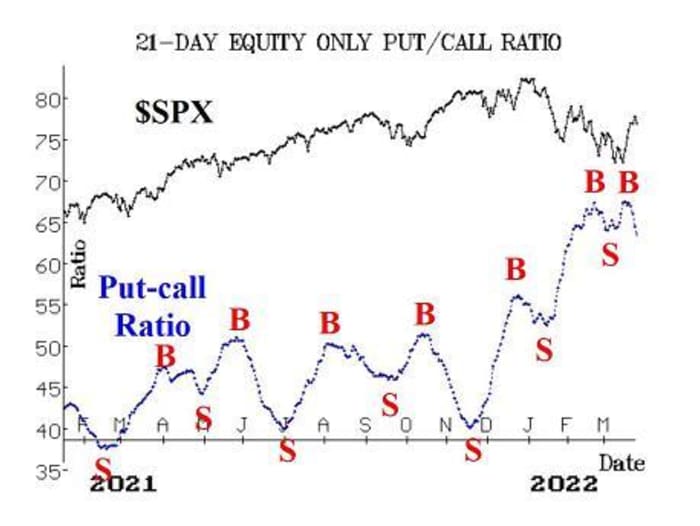
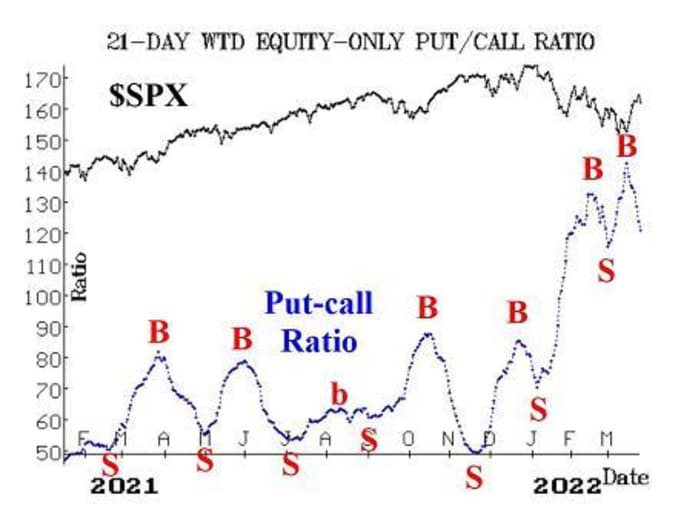
Equity-only put-call ratios are both on buy signals now, after having risen to extreme heights – that is, they were very oversold. Typically, buy signal from these heights are some of the best ones. These ratios are declining ratios, and as such are bullish for stocks.
I would prefer to see both break down below their February lows in order to give more confirmation to the relatively new signals, for twice before it appeared that they had topped out, only to see them reverse upward again strongly.
Lawrence McMillan
Lawrence McMillan
Breadth had improved during the rally, but now seems to be faltering again. Both breadth oscillators were on buy signals until Wednesday, when a severely negative day in the market, and in breadth, pushed the oscillators back onto sell signals. These oscillators have been whipsawing back and forth between buy signals and sell signals of late, without much sustainability. This last buy signal lasted for five trading days, which is the longest this year.
If breadth is negative again today, this most recent sell signal might be worth acting on; otherwise, it is not.
New 52-week highs have improved in relation to new 52-week lows, especially in terms of NYSE and “stocks only” data. This has mostly been due to the fact that new lows have fallen to very low numbers.
What we need to see, in order for this indicator to generate a new signal, is for new highs to outnumber new lows and for new highs to be sufficiently large (say, over 100) for two consecutive days. That has not happened so far, so this indicator is not yet on a buy signal.
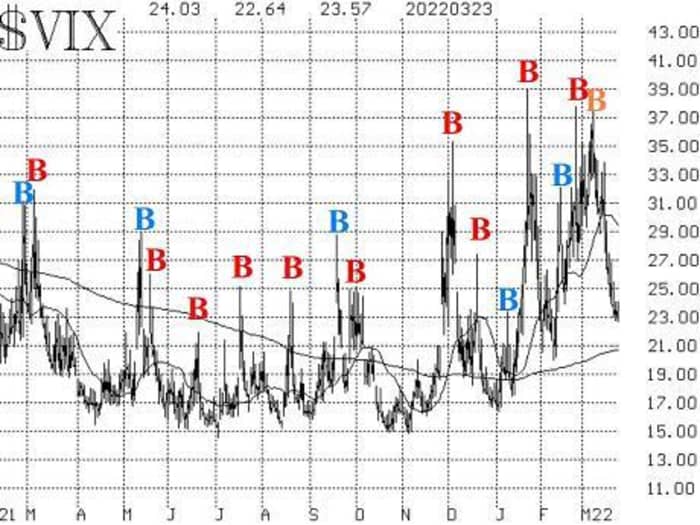
VIX
VIX,
has declined during the stock market rally, and that has made a strong winner of the VIX “spike peak” buy signals (buy signals for the stock market, that is) that were generated on Feb. 24 and again on March 9. We would exit this “spike peak” signal if VIX were to return to “spiking mode” – i.e., if it rises at least 3.00 points over any one-, two- or three-day period, using closing prices.
Despite the recent decline in VIX, it is not a completely bullish signal for stocks. VIX remains above its 200-day moving average. It would have to close slightly below 21 in order to close below the 200-day. As long as VIX is above the 200-day, the overall trend of VIX remains higher, and that can be a problem for stocks.
Lawrence McMillan
The construct of volatility derivatives has improved somewhat, and it is modestly positive for stocks. The term structure of the VIX futures slopes upward for the first four months (the front month is now the April VIX futures). Moreover, the VIX futures are trading at a premium to VIX once again. Finally, the CBOE Volatility Index term structure slopes upward too.
In summary, we are maintaining the “core” bearish position as long as SPX continues to trade below 4600. Around that bearish position, we have traded several oversold buy signals from certain individual indicators. We will continue with that approach, while rolling options to lock in profits and adhering to the stops that the various systems call for.
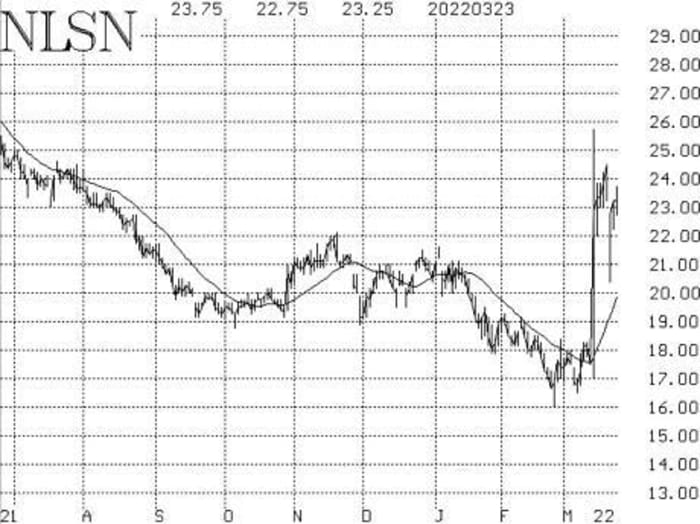
New recommendation: Nielson Holdings
Option volume in Nielson Holdings
NLSN,
has remained elevated. This is in response to news that Nielson had rejected a $25.40-per-share cash offer from a group of private-equity firms as this “significantly undervalued” the company.
Buy 3 NLSN May (20th) 22 calls
At a price of 2.50 or less.
NLSN: 23.23 May (20th) 22 call: 2.20 bid, offered at 2.55
Lawrence McMillan
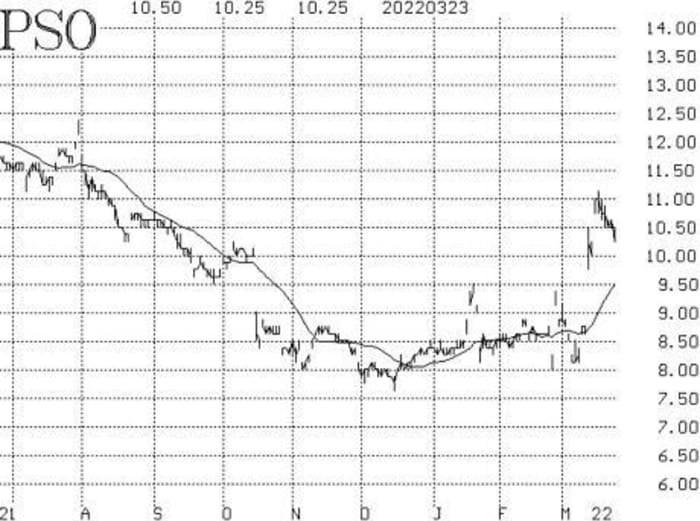
New recommendation: Pearson PLC
Option volume in Pearson
PSO,
has been strong for four of the last five days. The company had rejected a cash offer of slightly more than $11, from Apollo Global Management and its subsidiaries. Now there are rumors that Apollo is going to raise the price. Stock volume patterns are positive and improving.
Buy 5 PSO Apr (14th) 10 calls
At a price of 0.90 or less.
PSO: 10.31 Apr (14th) call: 0.70 bid, offered at 0.95
We will hold without a stop initially.
Lawrence McMillan
Follow-up action
All stops are mental closing stops unless otherwise noted.
We are going to implement a “standard” rolling procedure for our SPY spreads: in any vertical bull or bear spread, if the underlying hits the short strike, then roll the entire spread. That would be roll up in the case of a call bull spread, or roll down in the case of a bear put spread. Stay in the same expiration, and keep the distance between the strikes the same unless otherwise instructed. Since the short strike in several of our bull spreads is not that far away (452 being the nearest one), these rolls could arise soon.
Long 700 FTK: Flotek Industries
FTK,
continues to be strong. We previously took a partial profit on 300 shares. The closing stop remains at 1.40.
Long 1 SPY Apr (14th) 448 call and short 1 SPY Apr (14th) 460 call: This position was taken in line with the MVB buy signal. This signal will remain in effect unless SPX closes below its -4σ “modified Bollinger Band” (mBB) or trades above the +4σ Band. Neither was triggered last week.
Long FUN Apr (14th) 60 calls: We will hold without a stop as these takeover rumors play out.
Long 1 SPY April (14th) 420 put and short 1 SPY April (14th) 390 put, plus also long 1 SPY Apr (14th) 440 put and short 1 SPY April (14th) 410 put: This is our “core” bearish position. Stop yourself out if SPX closes above 4600.
Long 1 SPY Apr (14th) 437 call and short 1 SPY Apr (14th) 452 call: A call bull spread was bought on Feb. 24 in line with the VIX “spike peak” buy signal that occurred that day, and that has since been rolled up. Stop yourself out if VIX returns to “spiking mode” – that is, if VIX closes at least 3.00 points over any one-, two- or three-day period.
Long 2 ZEN April (14th) 125 calls and Short 2 April (14th) 140 calls: Hold without a stop while the activist activity is in progress.
Long 2 BBBY April (8th) 21 calls: Stop yourself out on a close below 18.
Long 2 ORCL May (20th) 77.5 calls: We bought these near the close of trading on March 15, when Oracle
ORCL,
closed above 78. We will hold as long as the put-call ratio buy signal is in effect, which it still is.
Send questions to: lmcmillan@optionstrategist.com.
Lawrence G. McMillan is president of McMillan Analysis, a registered investment and commodity trading advisor. McMillan may hold positions in securities recommended in this report, both personally and in client accounts. He is an experienced trader and money manager and is the author of the bestselling book “Options as a Strategic Investment“.
Disclaimer: ©McMillan Analysis Corp. is registered with the SEC as an investment advisor and with the CFTC as a commodity trading advisor. The information in…
Read More: The S&P 500 chart is still bearish despite the stock market’s recent gains


