


Take a leap into the future: time to pivot your investment approach
Dilok Klaisataporn/iStock via Getty Images
Introduction
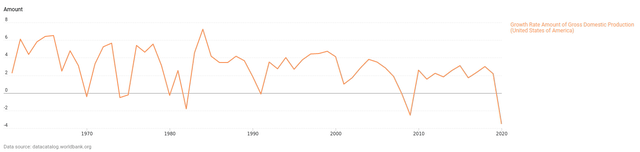
World Bank
When the economy is growing at an average of less than 3%, as the chart above demonstrates, how can the businesses that make up the economy grow at 16.6% per annum over the period 2011 to 2021?
Consider that for a moment before reading on.
I will explain where this additional value has come from and, more particularly, what it means for the future for your investments.
It would appear that the best strategy over the past ten years has run its course and now is the time to pivot.
I’ll explore passive investing in the S&P 500 (SPX)(SPY) and what that might yield over the next decade. I will then go on to apply the same unique analytical approach to Apple (AAPL), Google (GOOG) (GOOGL), Facebook/Meta (FB) and Amazon (AMZN).
The S&P 500 And Passive Investors
The chart below is fascinating. The dates at the bottom are the secular peaks and troughs in the stock market over the past century going back to the great depression in 1929.
The red line shows the S&P 500 (and equivalent going back in history). Since 1982 it is easy to see the peaks and troughs but due to the scale it is more difficult for the early dates. For this reason I have added the values of the index in red to enable you to see how the index oscillated up and down at that time.
I also plot the market cap of all US stocks against US GDP (this is one of Warren Buffett’s favourite macro-economic metrics). You will note that every market peak coincides with a peak in the market cap to GDP ratio, and the troughs similarly align.
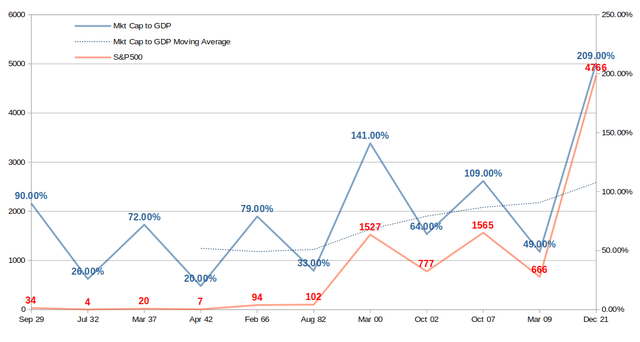
Author’s chart
We appear to be at a cyclical peak right now, but more concerning is that we are off the scale relative to the moving average (dotted line).
The moving average trend is upwards. This is easily explained on the grounds that the technology businesses of today grow more quickly than the industrial companies of yesteryear hence the fatter price premiums.
However, that does not fully explain why the market has, in recent years, run so far ahead of itself with an unprecedented 209% market valuation to GDP ratio as at the end of 2021. To understand how this has happened we need to dig deeper and take a more granular look at how we got to where we are. Only then will we be able to formulate an opinion on where we may be heading which ought to inform future investment decisions.
As an investor you must have an expectation for growth in sales per share, changes in profit margins and a reasonable expectation of fair multiple to be paid for those margins. These are the primary elements that will drive your return on investment. The other component will be any dilution or accretion from changes in the share count.
At the beginning of the last decade the net profit margin was 9.2% on the S&P 500 and the average market capitalization stood at 13 times earnings, resulting in an index of 1,257 which was 1.17x sales.
To put things in perspective, over the past century average net profit margins were closer to 6.5%, so 9.2% was historically very high even then.
However, ten years later the profit margin has expanded to a record 13.4% and the index is capitalized at an average 23.6 multiple of earnings, so the index closed 2021 at 4,766. This was 3.17x sales which is similarly unprecedented for the S&P500.
When we combine the expansion in net profit margin, the expansion in earnings multiples and sales per share growth which was 3.7% CAGR, the index compounded by a historically eye-watering 16.6%.
This total return can be mathematically broken out (the math is beyond the scope of this article) as follows in order to determine how it was achieved with reference to growth in sales, growth in margins, growth in multiples changes in share count and dividend yields.
We are thus able to reverse calculate the individual components of the 16.6% annual growth for the S&P 500 over the past decade as follows:
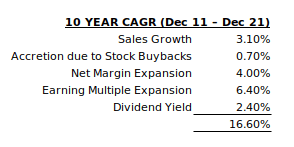
Author’s calculations
The largest component was the multiple expansion from 13.0x to 23.6x, an increase of 81% which contributed 6.4% annually to shareholder returns. To repeat this over the next decade the average earnings multiple for the index would need to reach 42.7x. That’s never happened before and the long term average is closer to 15x so how likely do you think that is?
The next biggest constituent of the return was the net profit margin which grew from what was already a record 9.4% to a new record 13.4% (see chart below).
Much of this profit growth can be attributed to the tax cuts introduced by Trump (TCJA) in 2017. When these cuts occurred every company in the US received a boost of 21.5% to their bottom line (profit after tax increased from 65c to 79c in every Dollar) and most of this gain has now been competed away. It was a political stunt which caused the market to rally and will not be repeated. More concerning is that the tax cuts are almost certain to be undone by the Biden administration which will have the opposite effect on corporate profits.
Then we have the issue of raging inflation and higher interest rates, both of which will increase operating costs and so adversely impact margins. Interest rates are rising to tackle troublesome inflation with the Fed having already hiked rates for the first time since 2018 and signaled another six rate hikes this year with three more in 2023. This puts US rates at approximately 2% at the end of this year rising to around 2.75% next year. Moving from rates of 0.25% to 2.75% in the space of two years is an 11x increase in funding costs. That eats into profit margins and curtails growth.
Against this backdrop, do you expect net profit margins to move higher or lower in future?

Author’s chart
The chart demonstrates how profit margins are well above long term trend for the reasons discussed above. It also shows the cyclically adjusted price-to-earnings ratio (commonly known as CAPE, Shiller P/E, or P/E 10 ratio) which is price divided by the average of ten years of earnings, adjusted for inflation (hence the different values to the LTM earnings multiples mentioned in the text above). Using CAPE paints a more accurate picture when analyzing a century worth of data.
Earnings multiples are equally unlikely to remain so far above the long term average given that multiples are the premiums that the market pays based upon expectations of growth – we have already discussed that growth in coming years cannot match the past decade which was fueled by lax monetary and fiscal policy supplemented by stimulus from central banks.
So, we must conclude that unless net profit margins move higher from today’s record 13.4% (unlikely) and/or the businesses that make up the S&P 500 are capitalized on an earnings multiple beyond 23.6 (unlikely), there simply is no scope for the index to produce returns over the next decade that are even close to those produced in the last ten years. This was one of the best 10-year periods of all time. As such, index investors will achieve no more than growth in sales per share plus dividends.
Sales growth on a per share basis for the S&P 500 averaged 3.5% for the past decade. Given high corporate and government debt, growth going forward isn’t likely to be any higher. Coupled with today’s average 1.3% dividend yield, the average returns are unlikely to exceed 4.8% per annum.
That doesn’t meet the hurdle rate of many intelligent investors. It certainly does not provide a sufficient equity risk premium over the rising risk-free rate.
More of a concern is that if profit margins contract from their current elevated levels and if earnings multiples contract (equally likely for the reasons given) then investor returns are crushed.
Let us assume that sales growth, share buybacks and dividend yields remain constant but that profit margins move back to the last secular peak of 9.4% and earnings multiples move down to 18x (still above the long term average), this is what the index investor’s annual return looks like for the next ten years:
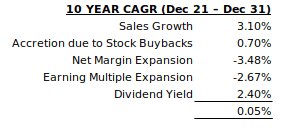
Author’s calculations
Ouch!
And those assumptions are relatively sanguine.
The passive investing crowd have done well over the past decade. They will experience a rude awakening in the next decade if they expect more of the same.
Now is the time to pivot in terms of investment strategy.
There is precedent for this situation.
The decade from 1989 to 1999 saw a total return of 18.3%
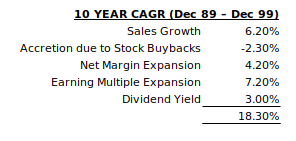
Author’s calculations
During the 1989 to 1999 decade the earnings multiple expanded from 14.5x to 28.4x, margins expanded from 5.4% to 8.0% and sales grew cumulatively by 78.8% over the ten year period. Share buybacks were not so much of a thing back then and so despite net share issuance diluting shareholders by 2.3% per year, investors still enjoyed an annual return of 18.3% in that period.
However, the decade that followed saw the earning multiple contract back to 19.6x, margins contracted to 6.3% and sales only grew cumulatively by 49.1% over the decade. The result was a negative return for investors on an annual basis of -0.9%.
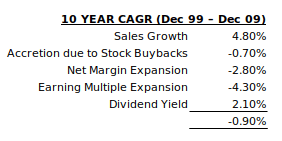
Author’s calculations
The market is no different from the biblical story of Joseph where seven good years are followed by seven bad years. In this way the pendulum swings back and forth either side of equilibrium.
The situation is no different for individual companies, no matter how good their business. Allow me to demonstrate on a micro economic level with reference to two iconic companies, Coca-Cola (KO) and Microsoft (MSFT).
In 1998 Coca Cola was trading for an eye watering 50 times earnings. The share price in that year peaked at $43. Twenty-three years later the price touched an all time high of $62. That’s a 1.64% CAGR. Twenty-three years of working the multiple down from 50x to 25x resulted in an awful return for anyone invested in an outstanding company with a dominant market position and a very wide moat. Price matters!
As I like to say, even the best company makes for a bad investment…
Read More: Time To Pivot: S&P 500, Apple, Amazon, Facebook And Google


