


Spencer Platt/Getty Images News
Introduction
In light of ongoing market “turmoil”, it’s time to talk about a stock that I recommend investors to buy on weakness. As a dividend growth investor, I’m constantly on the hunt for attractive long-term opportunities for myself and my clients/followers. In this case, we’re dealing with a stock that has everything I’m looking for in a dividend growth stock. Intercontinental Exchange Inc. (NYSE:ICE) offers high dividend growth, a sustainable debt load, and a stellar business model that comes with long-term outperformance thanks to high and rising free cash flow. Moreover, because of market weakness, the stock has once again reached a favorable valuation.
So, if you have a long-term investment horizon and the need for a stock where dividend growth is more important than a high yield, I invite you to read my thoughts on this Georgia-based financial giant.
High Yield vs. Low Yield
Before I started writing this article, I took some time to update my personal files, which I hadn’t done in a while. Especially because I’m once again going to spend time talking about growth and value, I wanted to share my own “average” yield with readers. As of April 23, 2022, the average yield on my dividend growth portfolio (95% of my net worth) is 2.4%. The yield on cost is 3.4%. I started my portfolio in 2020. The table below shows my holdings ranked from highest yield on cost to lowest yield on cost.
Author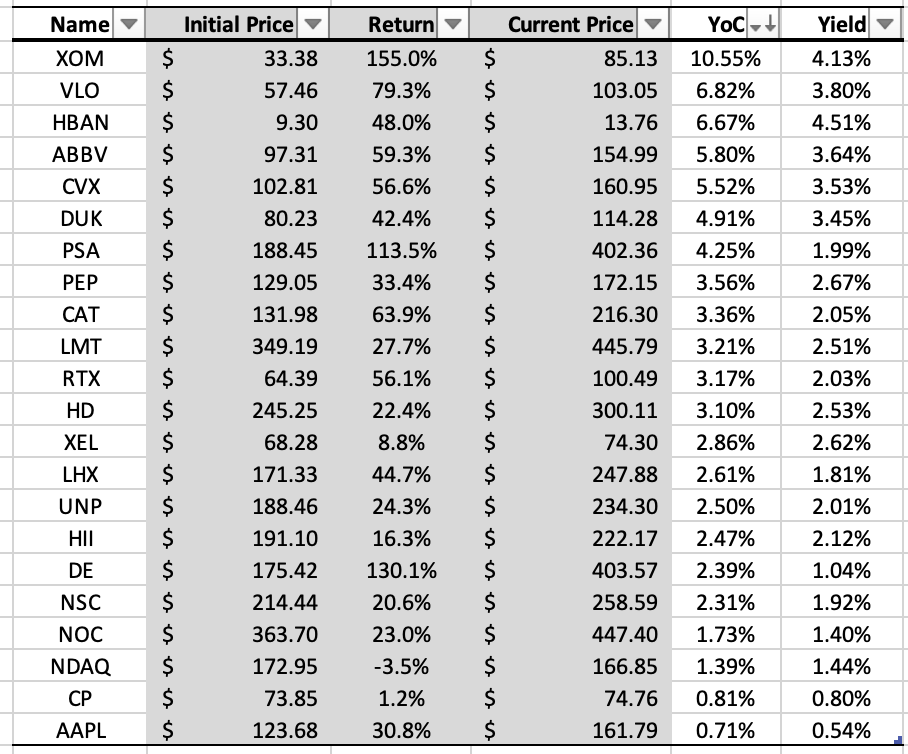
As the table above shows, I like to buy a mix of dividend growth and high yield. In this case, I only buy high yield when it’s on sale as that makes the impact of often slow dividend growth bigger. If I don’t find anything on sale, I don’t buy a high-yielding stock.
The reason why I prefer dividend growth stocks is that – historically speaking – they tend to come with significant outperformance. As the graph below shows, dividend growers and initiators outperformed an already stellar performance of dividend payers.
Hartford Funds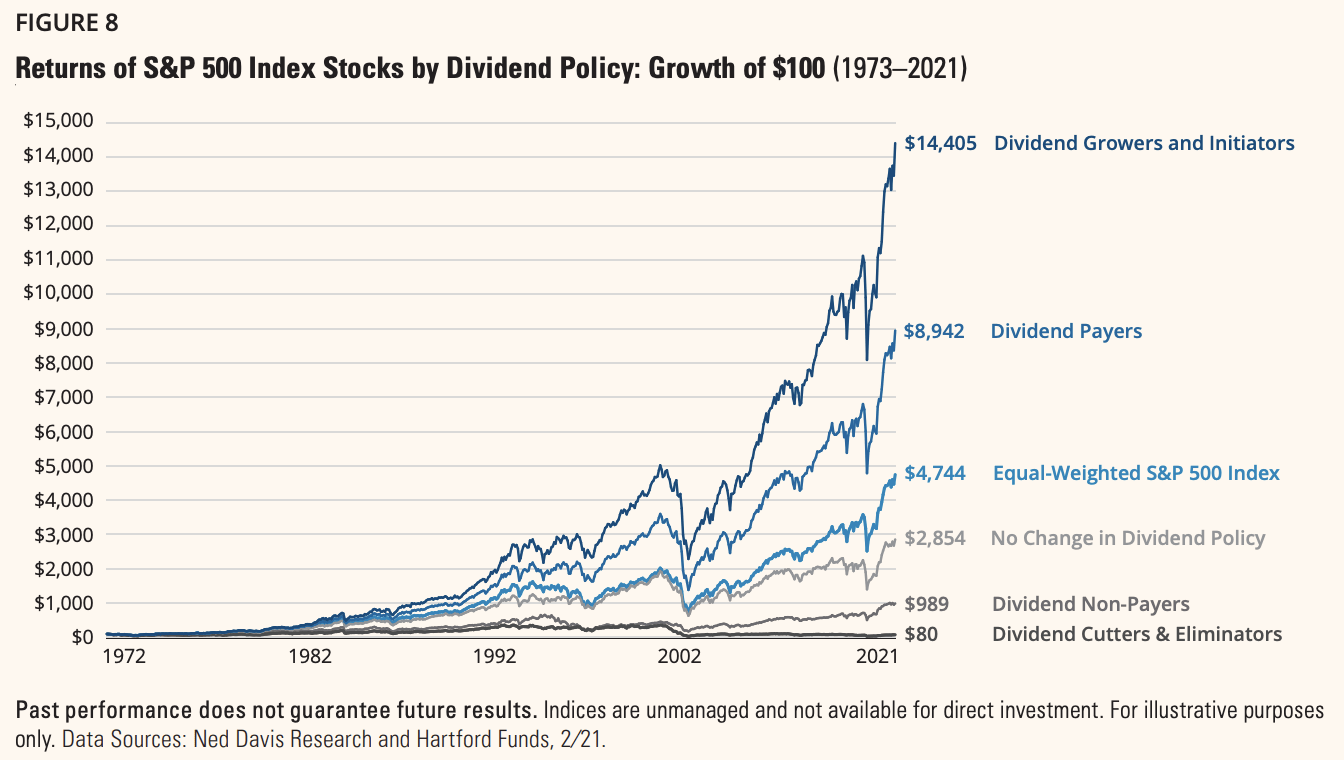
While it’s a lot of fun to receive high dividends every quarter, it’s more important that I don’t underperform the market. After all, it’s always possible to put (high) potential capital gains in high yield stocks when the emphasis shifts from growing wealth to preserving wealth and living off of dividends.
In the case of ICE, we’re dealing with an interesting dividend scorecard. The company achieves rather high scores on dividend safety and dividend growth, which are often highly correlated. For example, high free cash flow means high dividend safety, and it often also means that management uses the opportunity to grow its dividend more aggressively.
The dividend yield is graded a big fat D-. However, please bear in mind that this is RELATIVE grading. In this case, ICE, operating in the Financial Data & Stock Exchange industry, is compared to the financial sector. This sector includes a lot of regional banks and money center banks with high dividend yields.
Seeking Alpha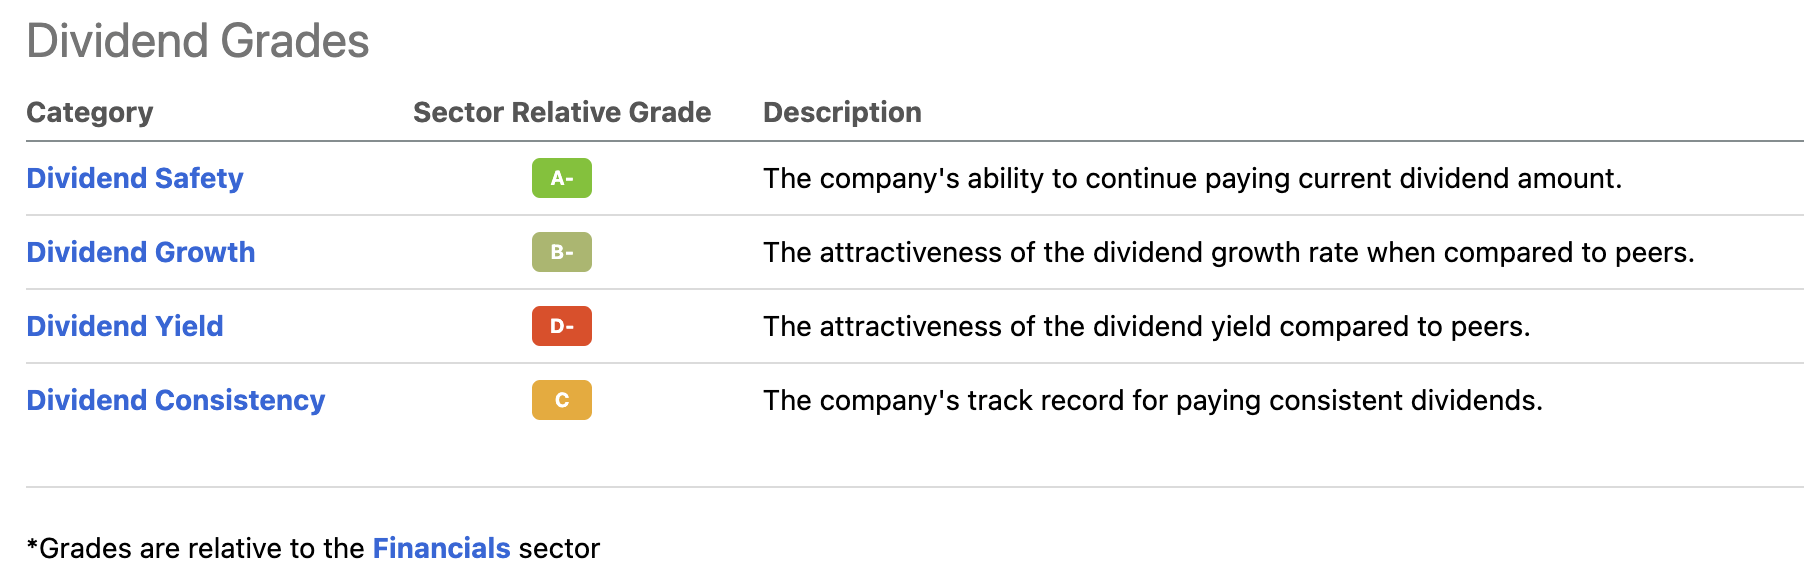
Intercontinental Exchange currently pays a $0.38 quarterly dividend per share. This is the result of a 15.2% hike announced on February 3, 2022. This puts the annual payout at $1.52. This implies a 1.30% dividend yield based on the current $117 stock price. The S&P 500 is also yielding 1.30%.
Now, let me explain why the company is outperforming the market – by a lot.
ICE, Home Of Loads Of Shareholder Value
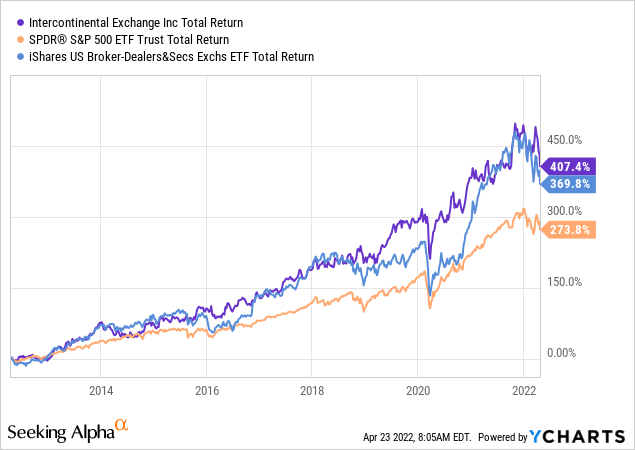
In light of the chart showing the S&P 500 performance breakdown chart, let me start this segment by showing that ICE is indeed outperforming the market.
Over the past 10 years, ICE has returned 407% including dividends (total return). This beats the iShares US Broker/Dealer ETF (IAI) by almost 40 points. The S&P 500 returned 274%, which isn’t bad either but much lower. The outperformance becomes even more extreme when zooming out, which confirms the basic theory that (sustainable) dividend growth outperforms the market.
The fact that ICE can outperform the market starts with its business model. ICE has a massive footprint in the financial industry, mainly in global exchanges, fixed income, and mortgage technology.
This is what I wrote last year:
Over the past 20 years, the company has become a financial powerhouse with a market cap of more than $66 billion and roughly 9,000 employees across the globe. On a full-year basis, the company generates roughly 55% of its sales through its exchanges business. 27% of its sales come from fixed income and data services, while 18% of sales are provided by mortgage technology. The company’s timeline below shows how this was achieved through the acquisitions of various large institutions. For example, in 2013, the company bought NYSE Euronext, which expanded the company’s footprint in equities and options. This organization operates a wide variety of securities exchanges, including the New York Stock Exchange, Euronext, and NYSE Arca.
Intercontinental Exchange Inc.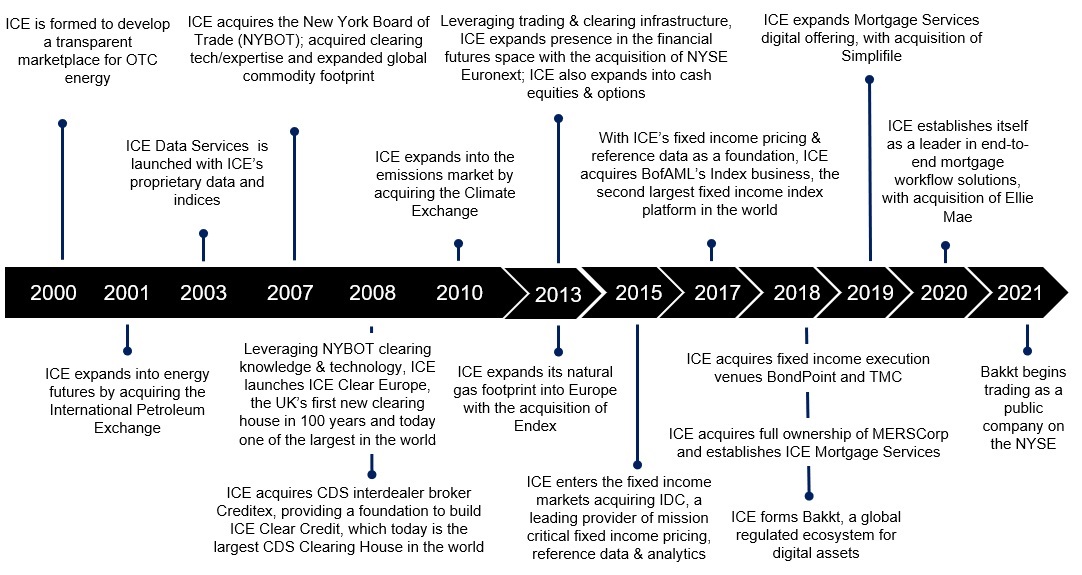
The company’s portfolio includes agriculture futures (like coffee and orange juice), energy, equities, forex, metals, as well as credit and other futures on an international scale. On March 31, the company announced that it will launch mortgage futures. 10 days prior to that, it announced biotech and semiconductor index futures.
This business model allows the company to benefit from increasing global transactions, the need for clearing services, hedging requirements, and more automated and advanced mortgage industry.
Between 2006 and 2021, the company has grown adjusted earnings per share from $0.48 to $5.15, which translates to a compounded annual growth rate of 17%.
Intercontinental Exchange Inc.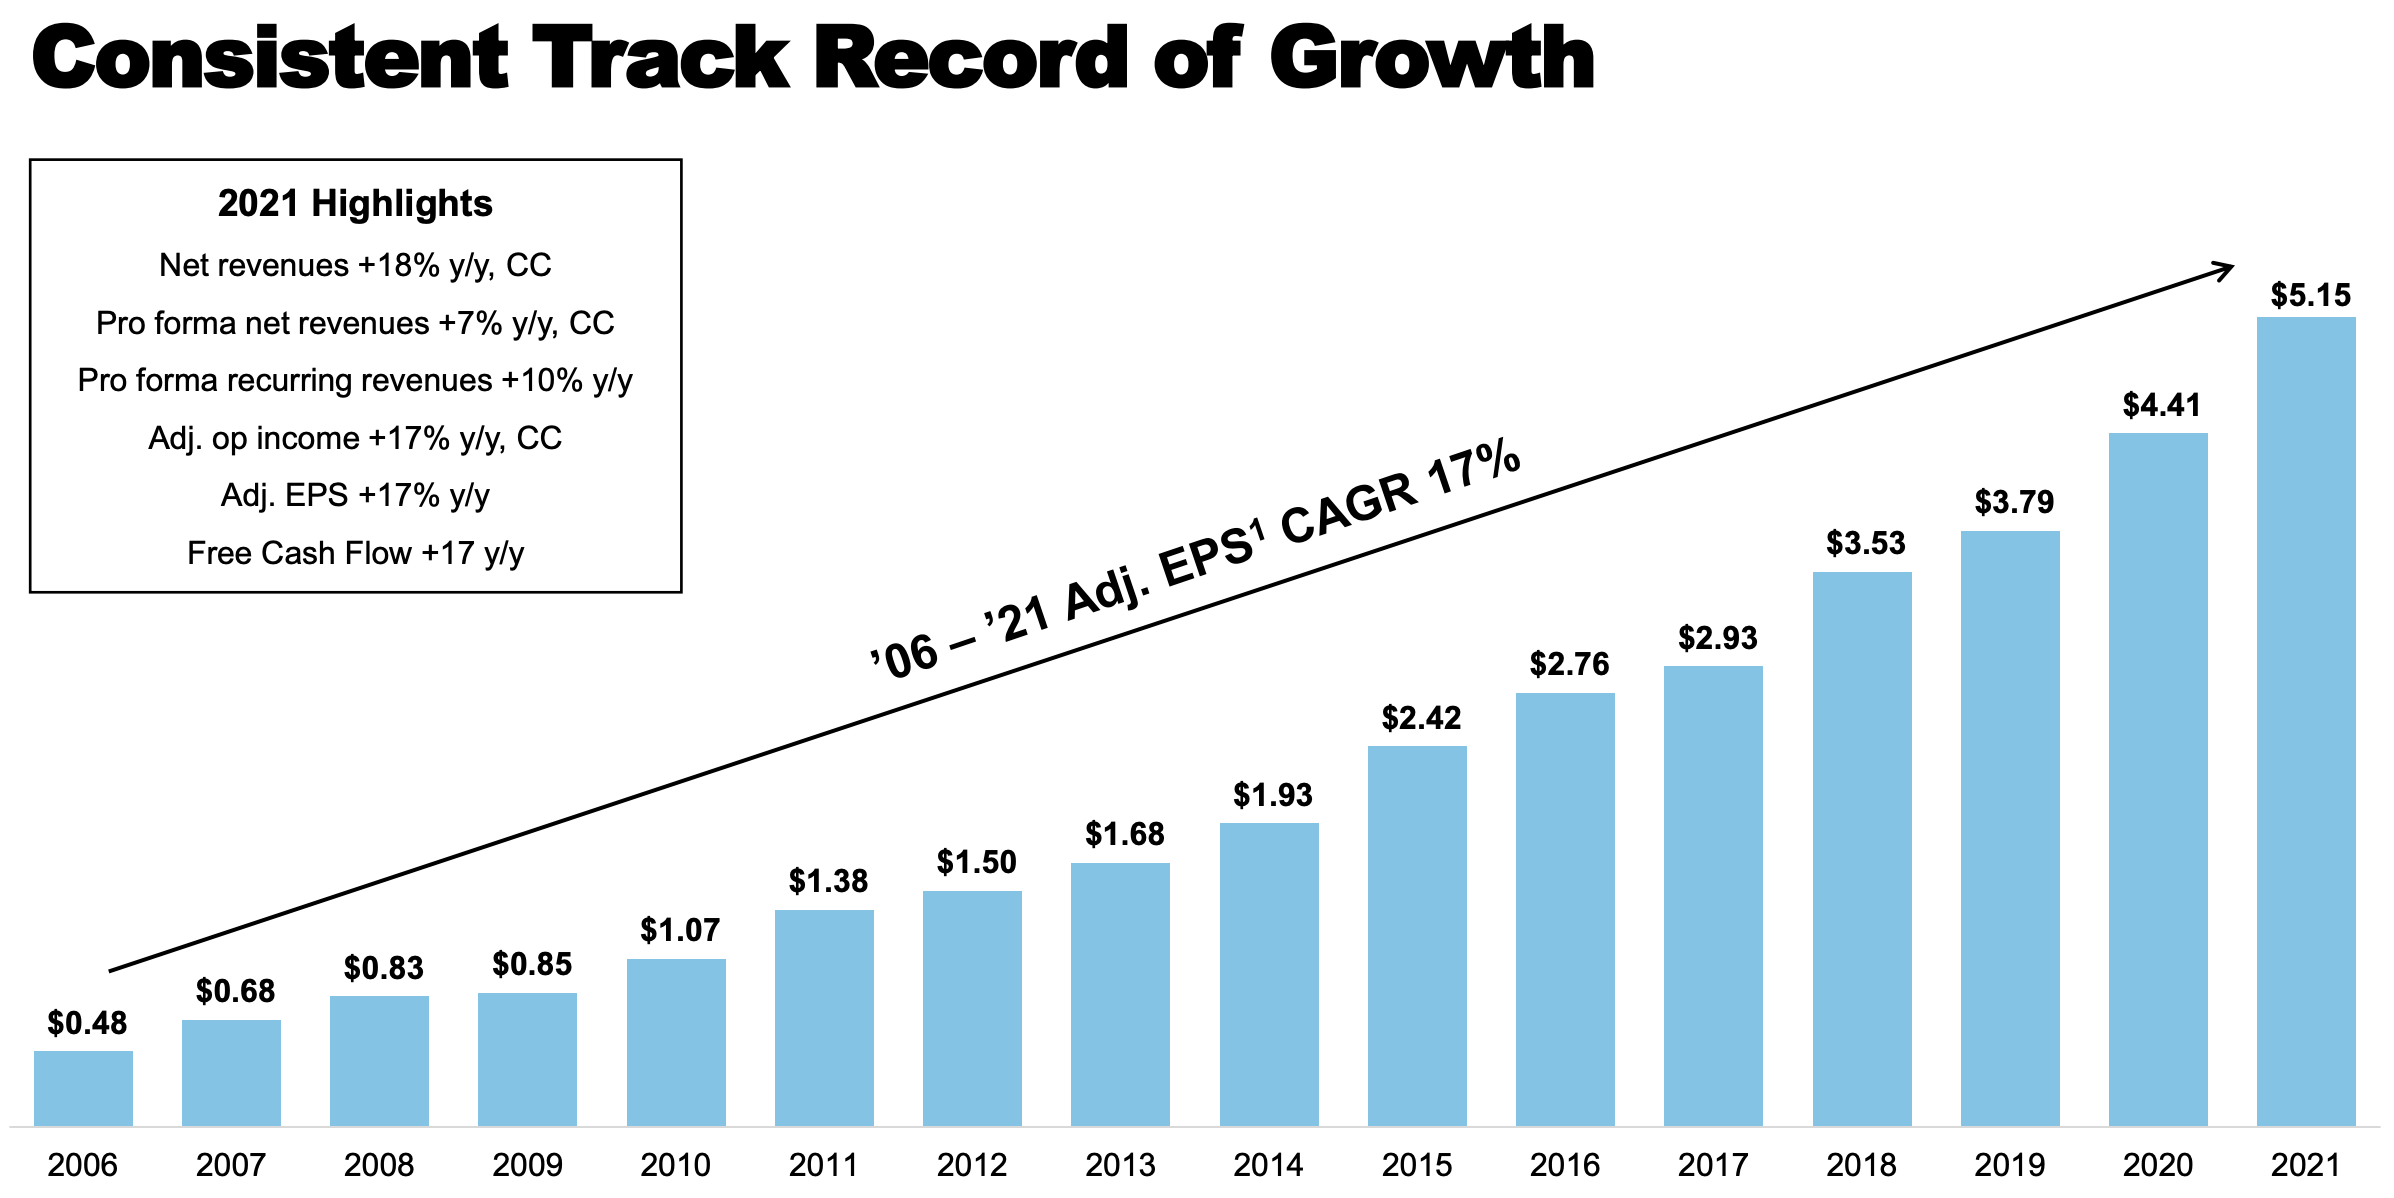
In this case, the company is generating a lot of free cash flow as well. Before I show you the numbers, keep in mind that free cash flow is basically net income adjusted for operating non-cash items and capital expenditures. It’s cash a company can spend on dividends, buybacks, and debt reduction.
The graph below shows total (expected) free cash flow and shareholder distributions consisting of direct distributions (dividends) and indirect distributions (share buybacks). Between 2011 and 2024 (expected), free cash flow is rising by 13.6% per year. This is resulting in close to $3.5 billion in expected 2023 free cash flow.
Author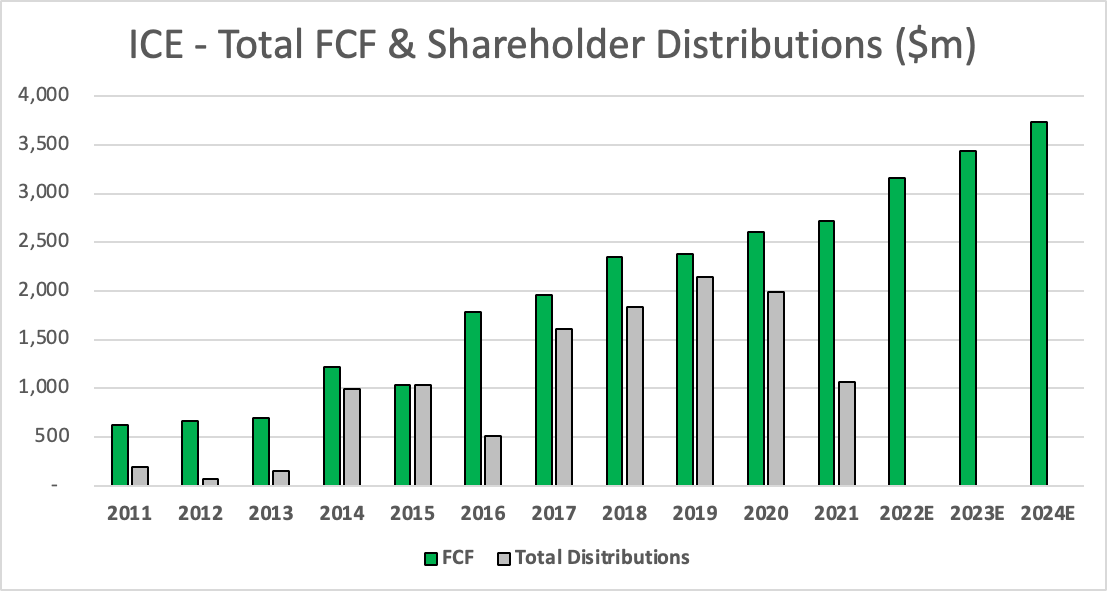
To put these numbers into perspective. ICE has a $66 billion market cap. $3.5 billion in free cash flow implies a free cash flow yield of 5.3%. As the company’s dividend yield is just 1.3%, it means there is a lot of room for dividend growth and annual buybacks to boost returns.
The next graph shows annual buybacks and dividends. ICE clearly emphasizes buybacks in times when free cash flow is high.
Author
While buybacks are volatile (they almost always are), dividends are more consistent. ICE initiated its dividend in 2013, which makes it one of the younger dividend growth stocks on the market. Over the past 5 years, dividend growth has averaged 19.0% per year. While I do not expect that number to last, I think longer-term dividend growth will remain close to 15%. Again, that’s not a promise, but it’s extremely reasonable based on the numbers.
TIKR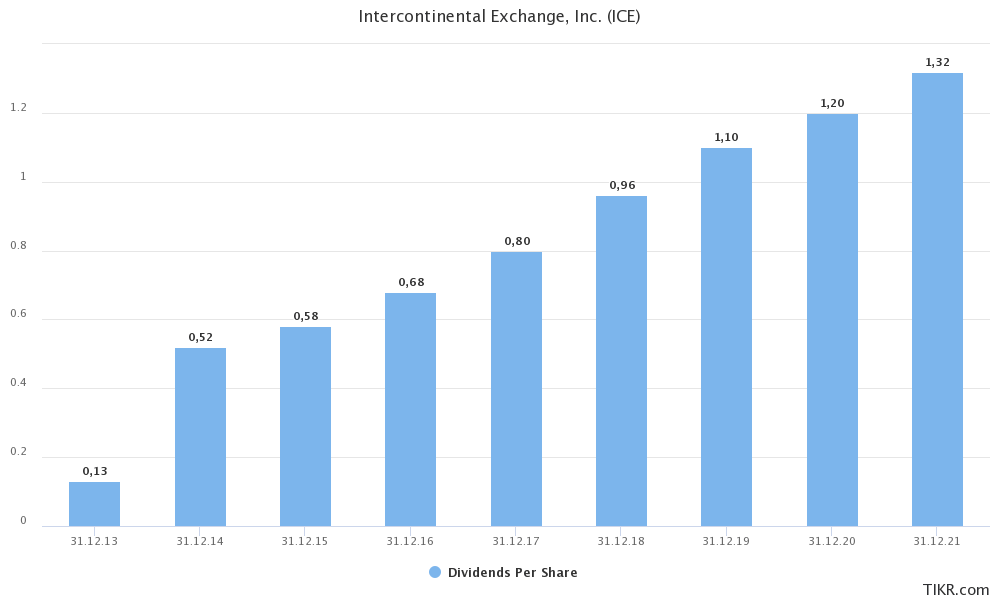
Moreover, the company will more than likely continue to engage in bigger acquisitions to shape its business model and deploy free cash flow. This will not necessarily impact dividends, but it will impact share buybacks as big acquisitions require new debt (not enough free cash flow). Last year, for example, buybacks were reduced to focus on debt reduction after the 2020 acquisition of Ellie Mae.
Author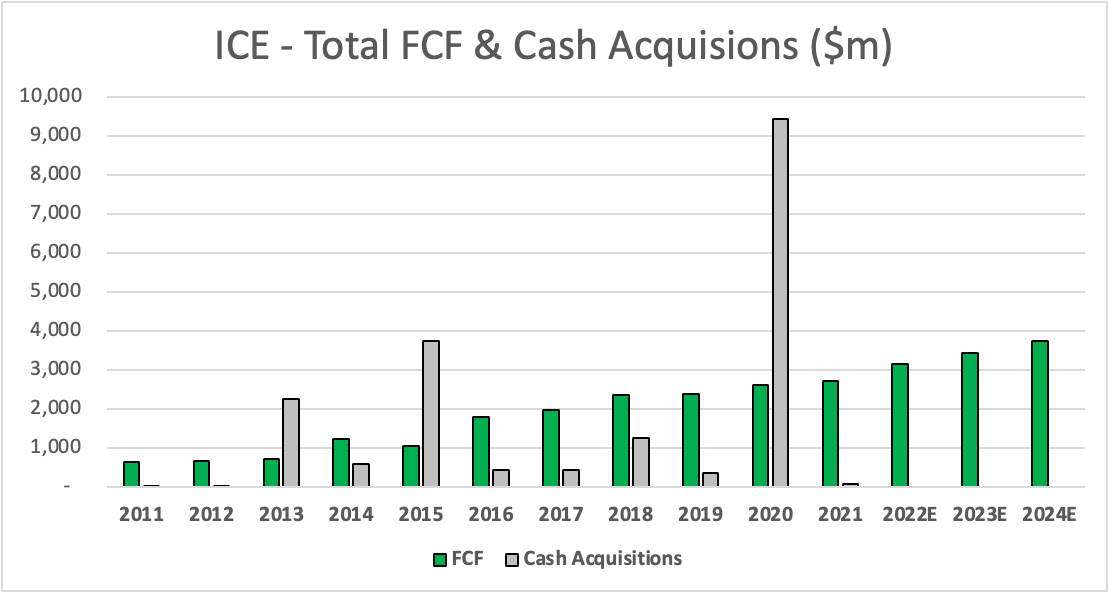
This acquisition gave the company a huge footprint in mortgages, which is expected to boost secular growth based on analog to digital conversion across the entire workflow. In 2021, the mortgage segment reported 17% pro format growth. The company did $1.4 billion in revenue in what management believes to be a $10 billion total addressable market.
As the graph below shows, this deal pushed net debt to $16.0 billion, which was close to 4x EBITDA back then. In 2021, net debt was lowered to $13.3 billion due to lower buybacks. The net leverage ratio fell to 2.9x. Next year, net debt is expected to fall to $11.8 billion, which is barely higher than 2.3x EBITDA.
TIKR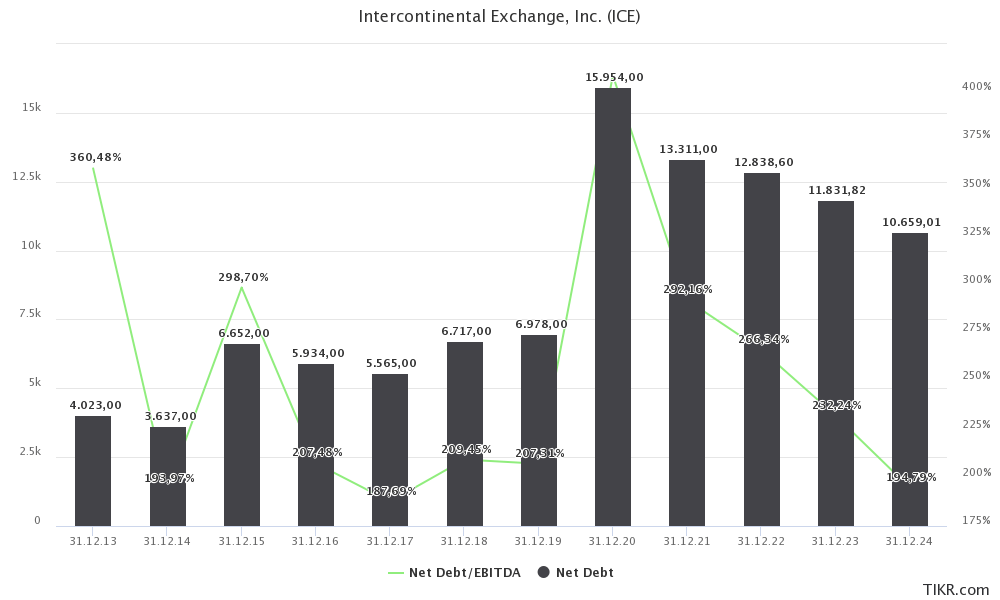
So, there’s one piece of the puzzle missing: valuation.
Valuation
This market is incredibly challenging – for traders. Last week was ugly as the market closed the week in correction territory (-10% from all-time high). We’re in a situation where multiple economic growth indicators are rolling over, inflation remains high, and geopolitical tensions continue to pressure supply chains (and inflation). Even worse, the Federal Reserve is now expected to start a rather aggressive hiking cycle. Once again, the Fed could find itself hiking into economic weakness.
Moreover, rates are high and consumer confidence is suffering. None of this will make life very hard for ICE, but it doesn’t support investors’ and traders’ willingness to take risks. As investors are de-risking their portfolios, we see that ICE is suffering too. The stock is down 5.9% last week, which lowers the YTD performance to -14.3%.
As a long-term investor, I’m not complaining. While it’s never fun to see a rather steep decline in one’s net worth every now and then, it does provide opportunities. And isn’t it more fun to buy at a good valuation than to chase prices to new highs?
FINVIZ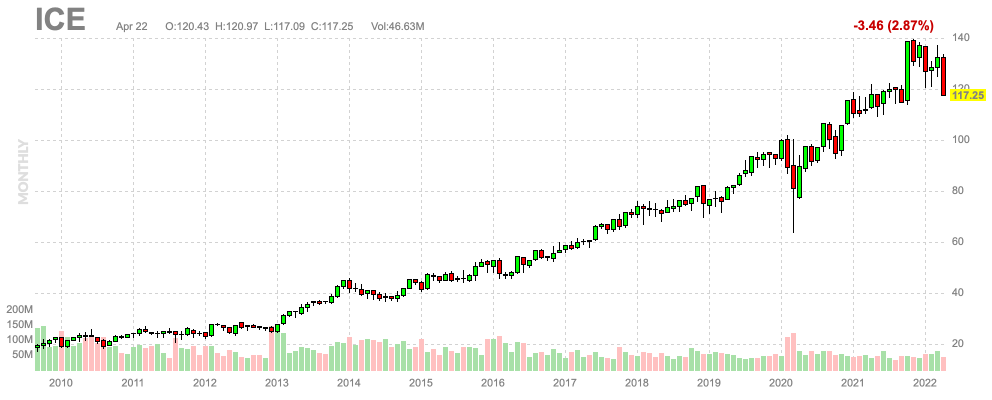
In the case of ICE, we’re dealing with a market cap of $66 billion as I already briefly mentioned in this article. Next year, the company is expected to lower its net debt to $11.8 billion. I’m going with that number instead of 2022 to price in the use of free cash flow when it comes to reducing debt. The company also has $200 million in pension-related liabilities and $40 million in minority interest, which we need to include as well.
This gives us an enterprise value of $78 billion. That’s 15.3x next year’s expected EBITDA of $5.1 billion.
It’s not a deal value multiple, but it’s good.
TIKR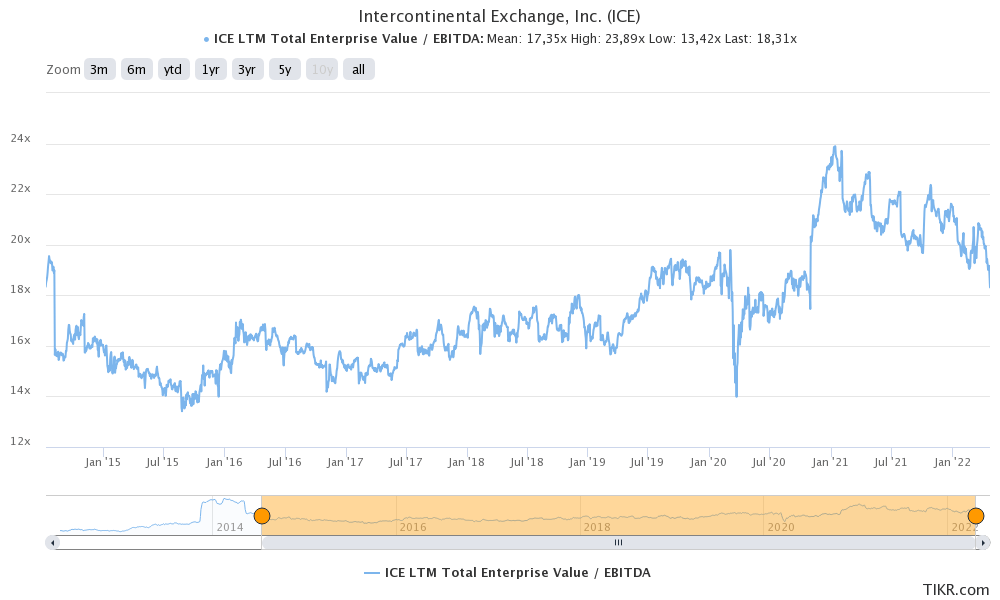
My recommendation…
Read More: Intercontinental Exchange: Decent Yield At An Attractive Price (NYSE:ICE)


