


Investment Thesis
Zoom (NASDAQ:ZM) was one of the best performing stocks during 2020. It grew around 430% and then managed to lose it all. However, the company’s execution has been diametrically opposed to its recent stock performance. The company grew its net margin from 4% to 36% and sits now on a pile of around $1.5 billion in free cash flow. So, let’s see what makes investors (myself included) not buy the stock of this great performing company.
KPIs
Besides the high NPS score (in September 2021 Zoom revealed a NPS score of 70+, which is great), good revenue visibility or high % of insider ownership (20%), I’m trying to focus on some operational KPIs that can paint a good picture for the company for both present and future growth prospects. We know that 67% of Zoom’s revenue comes from US at the end of 2021, so I’m trying to see if there are any signs that the US video-conferencing market might be exhausted.
Customers growth
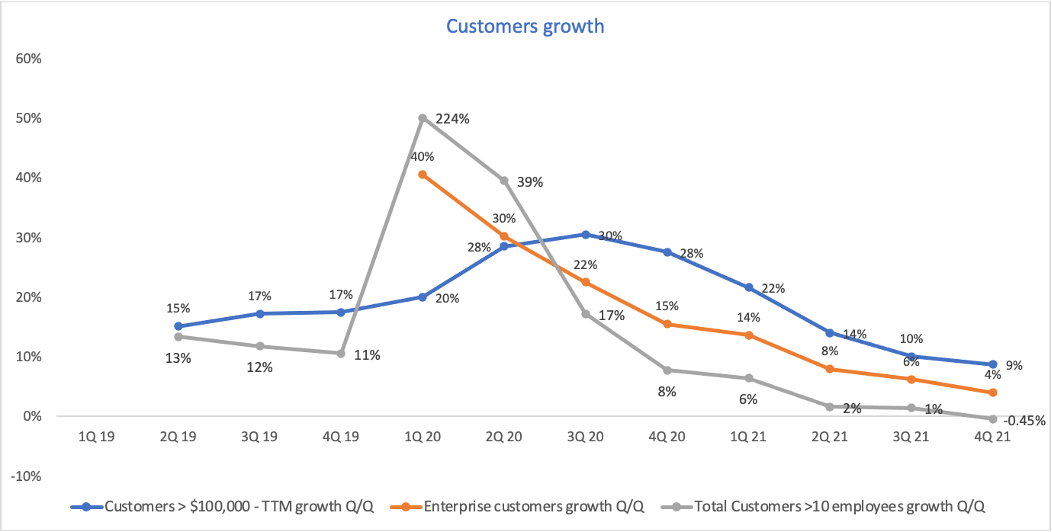
Source: Zoom 10-K FY22
Customers 10 employees decreased for the first time at the end of 2021 compared to Q3 2021. The company doesn’t disclose a churn rate, but instead it chose to focus on the Enterprise customers (customers that have been engaged by Zoom’s direct sales team). This category grew modestly in the last quarters, coming in with only a 4% growth quarter over quarter. After the huge pull-forward following the pandemic, Zoom made clear that it will allocate most of its resources on the enterprise segment, which is expected to become an increasingly higher percentage of total revenue over time.
Net Dollar Expansion Rate
The TTM Net Dollar expansion Rate is a measure that shows how much more does a customer spends on the Zoom platform as compared to 12 months ago. It includes any upsell or expansion from a customer. Zoom just started reporting this metric for both Enterprise and 10 employees customers, as in the past it would provide only one value for its Net Dollar Expansion Rate.
Net dollar expansion rate = Current Annual recurring revenue (ARR) / Annual recurring revenue (ARR) from 12 months ago
For its Enterprise customers, the Net dollar expansion rate has been consistently bigger than 130%. In its last quarter it was sitting at 130%, which is a great value for a software company.
For the 10 employees customers, it recorded a 129% value, after being higher than 130% for 14 consecutive quarters. This metric showcases that the company monetizes very well its existing customers.
Remaining Performance Obligation (RPO)
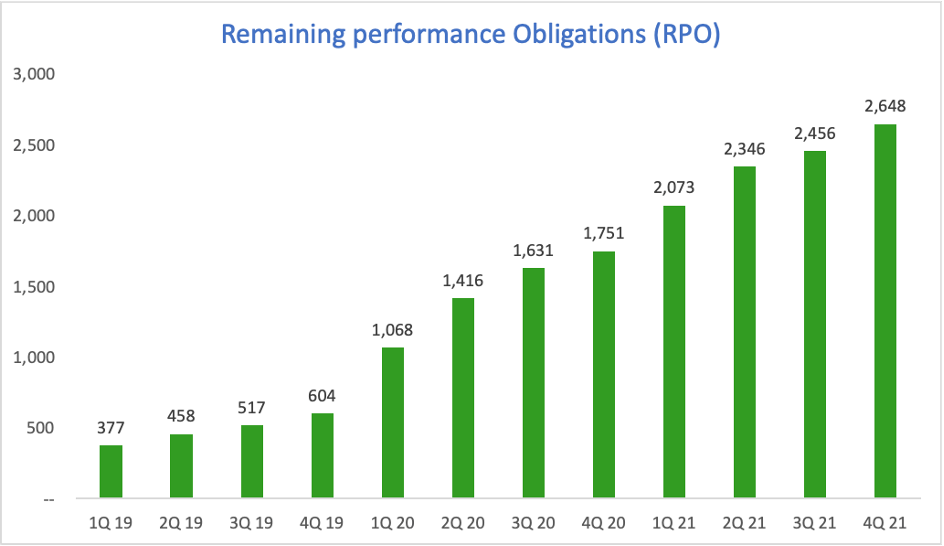
Source: Zoom 10-K FY22
Remaining performance Obligations (RPO) consists of both billed considerations and unbilled amounts that Zoom expects to recognize as revenue. RPO shows how much Zoom’s customers have committed to spend on the platform.
RPO = deferred revenue (billed, unearned revenue) + backlog (future performance obligations that haven’t been invoiced)
I believe the RPO will begin to decrease soon, unless the company can upsell its adjacent products at a faster pace than it did so far.
Customer Acquisition Cost (CAC)
This metric is very important and shows how well the company is using its sales & marketing team. It’s important to analyze sales efficiency to ensure that growth is efficient and sustainable.
CAC = S&M Expenses period n-1 / Nr of new customers in the current period
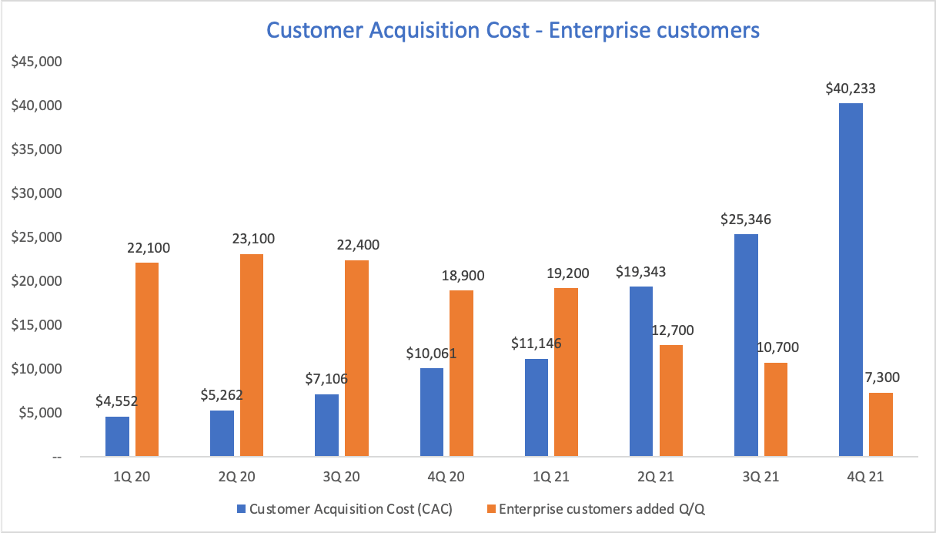
Source: Zoom 10-K FY22
Unfortunately for Zoom, for its Enterprise clients (customers that have been engaged by Zoom’s direct sales team) the CAC went through the roof. As we can see, less and less customers have been added in 2021 on a Quarter/Quarter basis while the S&M expenses have growth consistently.
As a result, the CAC is very high and it seems like Zoom has temporary difficulties into obtaining new customers. As a consequence, the lifetime value for the new customers is very low and it is generally lower than the cost of obtaining a new customer.
CAC Payback Period
This shows how many years it takes on average for a customer to produce enough gross profit to pay back its CAC.
CAC payback period = Average S&M Expense per customer / Average revenue per customer x Gross margin
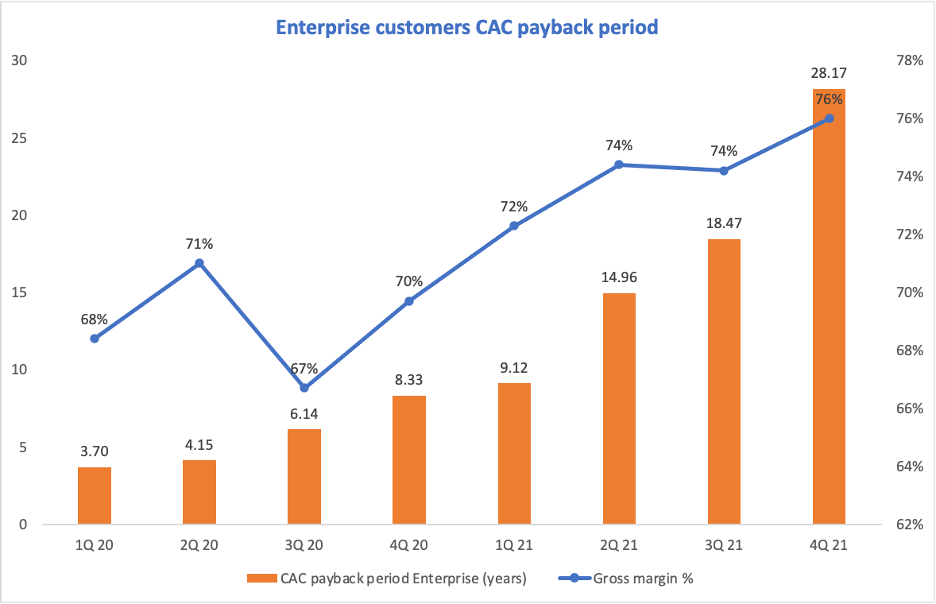
Source: Zoom 10-K FY22
As a consequence of the increase in the customer acquisition cost, the CAC payback period has seen a tremendous increase. This means it would take an average enterprise customer around 28 years to generate enough gross profit to compensate for the cost of acquiring the customer. The trend is definitely deteriorating and since there are only 2 variables included, CAC and Gross margin, even if the latter improved, the CAC growth outweighed the gross margin improvements. Moreover, the S&M spent in Q4 2021 is not included here, although it continues to grow and did so with 52% as compared to Q4 2020.
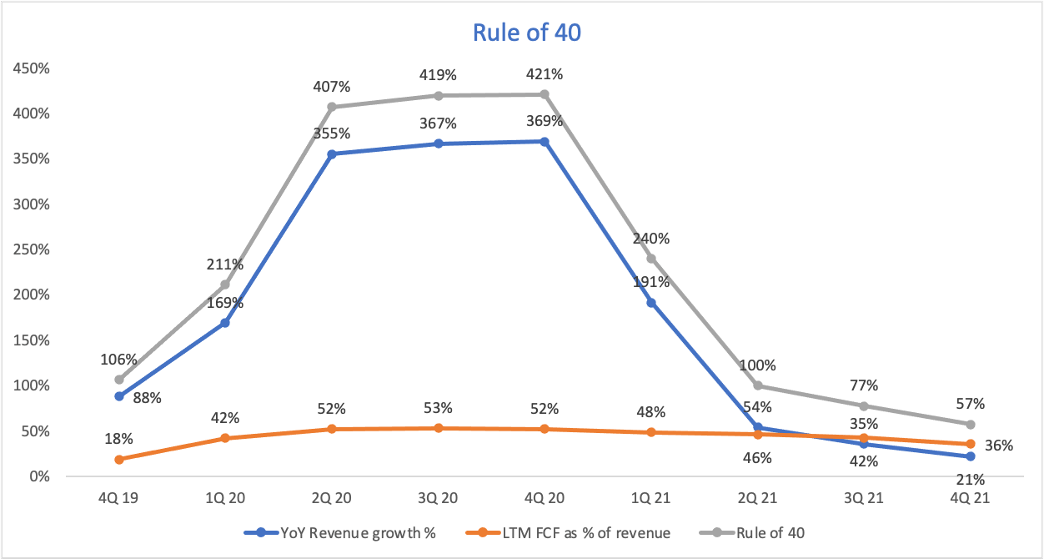
Rule of 40
Source: Zoom 10-K FY22
Rule of 40 is another crucial metric for the health of any software business. It takes into consideration two important operating metrics: YoY revenue growth % and Free cash flow as % of revenue for the last 12 months.
The company has consistently maintained a high free cash flow % as compared to the revenue. If before the pandemic the free cash flow was only around 18%, now it sits around 36%. This has been a great aspect for Zoom in the last two years as the company managed to transform more of its revenue into free cash flow.
As a conclusion, the rule of 40 remains a plus for Zoom since the company has a result of 57% in Q4 of 2021, but it needs to be followed closely in the subsequent periods.
To summarize the KPIs section, the sales efficiency metrics have deteriorated and the momentum gained in 2020 has definitely slowed down. Zoom is now in a position where it is forced to upsell its new offerings to existing customers. That will translate to a high NRR, so watch for this metric in order to see how the company does.
Is Zoom’s management allocating capital well?
One metric that can help paint a picture is the Return on Invested capital (ROIC):
ROIC = Net operating profit after tax (NOPAT) / Average Invested Capital which also translates into:
ROIC = EBIT (1-tax rate) / Total Assets – Short-term liabilities (non-interest bearing)
The reason why we calculate the return on invested capital is to compare it with the cost of capital (WACC). If a company has ROIC WACC, the company creates value for its shareholders. This principle is also explained by Warren Buffet in the 1$ test. Going further down a level, ROIC can be also expressed as a function of:
ROIC = NOPAT / Sales x Sales / Invested capital
What this analysis does is it tells us if the company has increased its net operating profit margin or if the return is better just because the company sold more units per 1$ invested (bigger sales turnover). Here’s how ROIC looks like for Zoom:
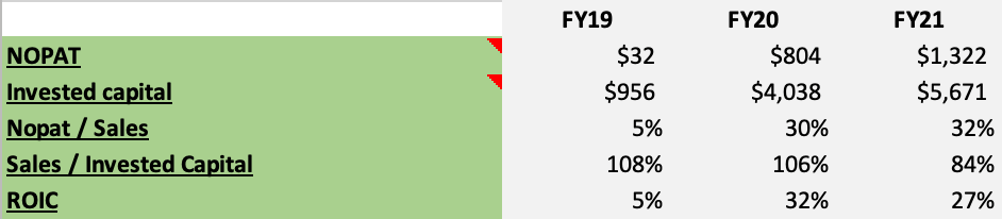
Source: Zoom 10-K FY22
For the above calculation I used 2 assumptions: The tax rate I used is 17.2%, which is the highest tax rate Zoom paid in any quarter. Zoom holds a lot of cash on its balance sheet. I did not remove the excess cash when I calculated the Invested Capital.
ROIC grew exponentially starting with 2020. This came as a result of both a better profit per sale (higher Nopat/Sales ratio) as well as a high number of sales for the same 1$ of invested capital. If we’re going to analyze the trend of the two in conjunction, we can see that most recently the operating profit margin has increased drastically while the contribution of the sales turnover has decreased.
To summarize, the low NOPAT margin from 2019 is explained by the growth nature of Zoom and the company has improved its NOPAT margin immensely during the last two years. This translated into a significant return on invested capital, much bigger than an average cost of capital for a SaaS business (usually lower than 10%). Zoom has captured successfully the tailwind that the COVID-19 pandemic created in its industry.
Upselling – the best way to grow?
For now, Zoom’s revenue comes mostly from Zoom Meetings. I think the penetration level for the additional products (only considering customers with more than 10 employees) is very low and Zoom might be struggling to upsell to its customers:
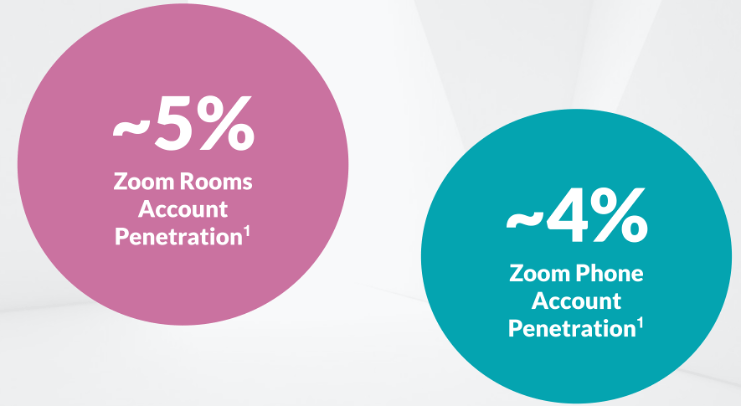
Source: Zoom Analyst Day FY22
On the flip side, since there are many existing customers, Zoom doesn’t have to spend money to attract new ones. They only need to gradually attract the customers to their platform while offering new adjacent products.
“We are going to target those customers who really want to standardize on Zoom platform, probably start from Meeting. And for those customers who deploy both Meeting and Phone, now they look at the Contact Center.” – Zoom CEO, February 2022
Zoom has surpassed the 2 million paid seats mark for Zoom Phone in September 2021 and has over 2.5 million paid seats at the end of January 2022. The company launched the service in January 2019 and in just two and a half years it has been able to become a significant player in the space. Most of the seats came from customers that are already using the Zoom Meetings, so upselling was crucial during this time:
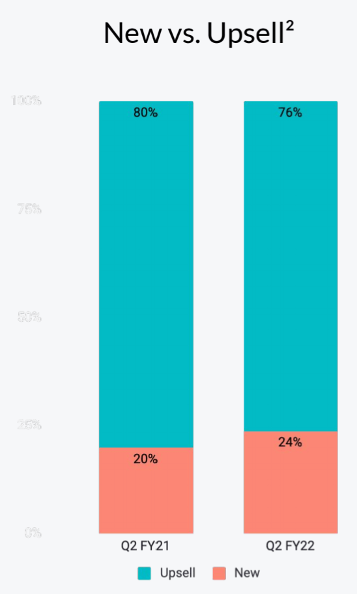
Source: Zoom Analyst Day FY22
Industry Fundamentals
A study published by Gartner in October 2021 puts Zoom in the “Leaders” category alongside Cisco and Microsoft for the video-conferencing space. When looking at an industry, I prefer to focus on three things that will tell me how easy can the company maintain market share:
Barriers to entry – With the recent technologic advancements, the service became very affordable, as we’ve seen entry prices as low as $4/license for a month of usage (Microsoft’s newest offering that takes aim at Zoom’s <10 employees customer base – which represents 33% of Zoom’s revenue). As a result, the barriers to entry are low.
Switching costs – The video conferencing solutions are only sticky from a contractual stance. The contracts for enterprises are usually signed for long-term periods and it might be difficult to convince customers to switch. However, the apps are now very intuitive and it is very easy to switch providers as it doesn’t require any training for the employees, which makes switching costs very…


![Just released: the 3 best small-cap stocks to buy right now [PREMIUM PICKS]](https://thedailystock.news/wp-content/uploads/2023/01/GardenFun-350x250.jpg)


