


MicroStockHub/iStock via Getty Images
Quality Stocks
The stock market was shaken in April as the S&P observed its worst month since March of 2020. My watchlist performed better, but still had a poor result, losing only 5.82%. The watchlist trailed VIG by 0.7% and beat SPY by 2.96% in April. My target annualized rate of return is 12% and after 20 months this watchlist still continues to maintain a better return, although it has dropped very close to my threshold currently sitting at just 13.87%. If we see another significant drop in the market in May the watchlist may dip below my long term return target. But that will be okay since short term volatility is normal and will not have a major impact on long term returns.
The main focus of this watchlist is to find the best combination of quality companies trading for attractive prices. I believe this is the optimal long term strategy to building wealth.
The top 15 dividend growth stocks for May offer an average dividend yield of 1.62%, that is better than last months yield of 1.39%. Collectively they have increased dividend payments at a rate of 31.58% during the last 5 years. Based on dividend yield theory these 15 stocks are about 25% undervalued right now, and I think they are poised to offer strong long term returns. Following the significant drop in the market in April, this month all 15 selected stocks are potentially undervalued.
I would recommend two approaches to dividend investing. The first is to dollar cost average into at least 10-20 or more quality dividend-paying stocks across multiple sectors and industries. By dollar cost averaging, you eliminate the risk of trying to value a stock and over a long enough period, theoretically, you will buy shares at market highs, lows, and in-between resulting in an average cost basis somewhere in the middle. The second method carries a little more risk. Invest in undervalued stocks also dollar cost averaging into at least 10-20 unique quality companies across multiple sectors and industries. The additional risk with this approach comes from the chance that your valuation method proves to be incorrect. However, by investing in multiple unique stocks, the odds that you accurately identify at least a few undervalued stocks increases. The resulting upside from a few correct picks may more than offset the underperformance from the bad ones.
Watchlist Criteria
The criteria used to determine which stocks are included in my high-growth dividend stock watchlist remains unchanged for May 2022. It is made up of the 8 factors listed below that have historically outperformed the broad universe of dividend-paying stocks when analyzed collectively.
- Market Cap of at least $10 billion
- Payout Ratio no greater than 70%
- 5-year Dividend Growth rate of at least 5%
- 5-year Revenue Growth rate of at least 2%
- 5-year EPS Growth rate of at least 2%
- S&P Earnings and Dividend Rating of B+ or better
- Wide or Narrow Moat (Morningstar)
- Exemplary or Standard Management Team (Morningstar)
The rules identified 120 stocks for the month of May that were all ranked based on the above mentioned metrics with the exclusion of market cap. I then computed the current valuation for each stock using dividend yield theory. All stocks were ranked for both quality and valuation and sorted by the best combination of both. Next I computed a forecasted rate of return for the next 5-year period for each of the stocks. This return is based on forecasted earnings growth, a return to fair value and the dividend yield. The highest ranked 15 stocks with a forecasted return greater than or equal to 12% were chosen for the May watchlist. Since I run my monthly high yield watchlist first, I exclude any overlapping stocks already selected on the current months high yield watchlist. The long-term hypothesis for this watchlist is that it will outperform a broad quality dividend fund such as Vanguard’s Dividend Appreciation ETF, VIG.
Watchlist For May 2022
Created by Author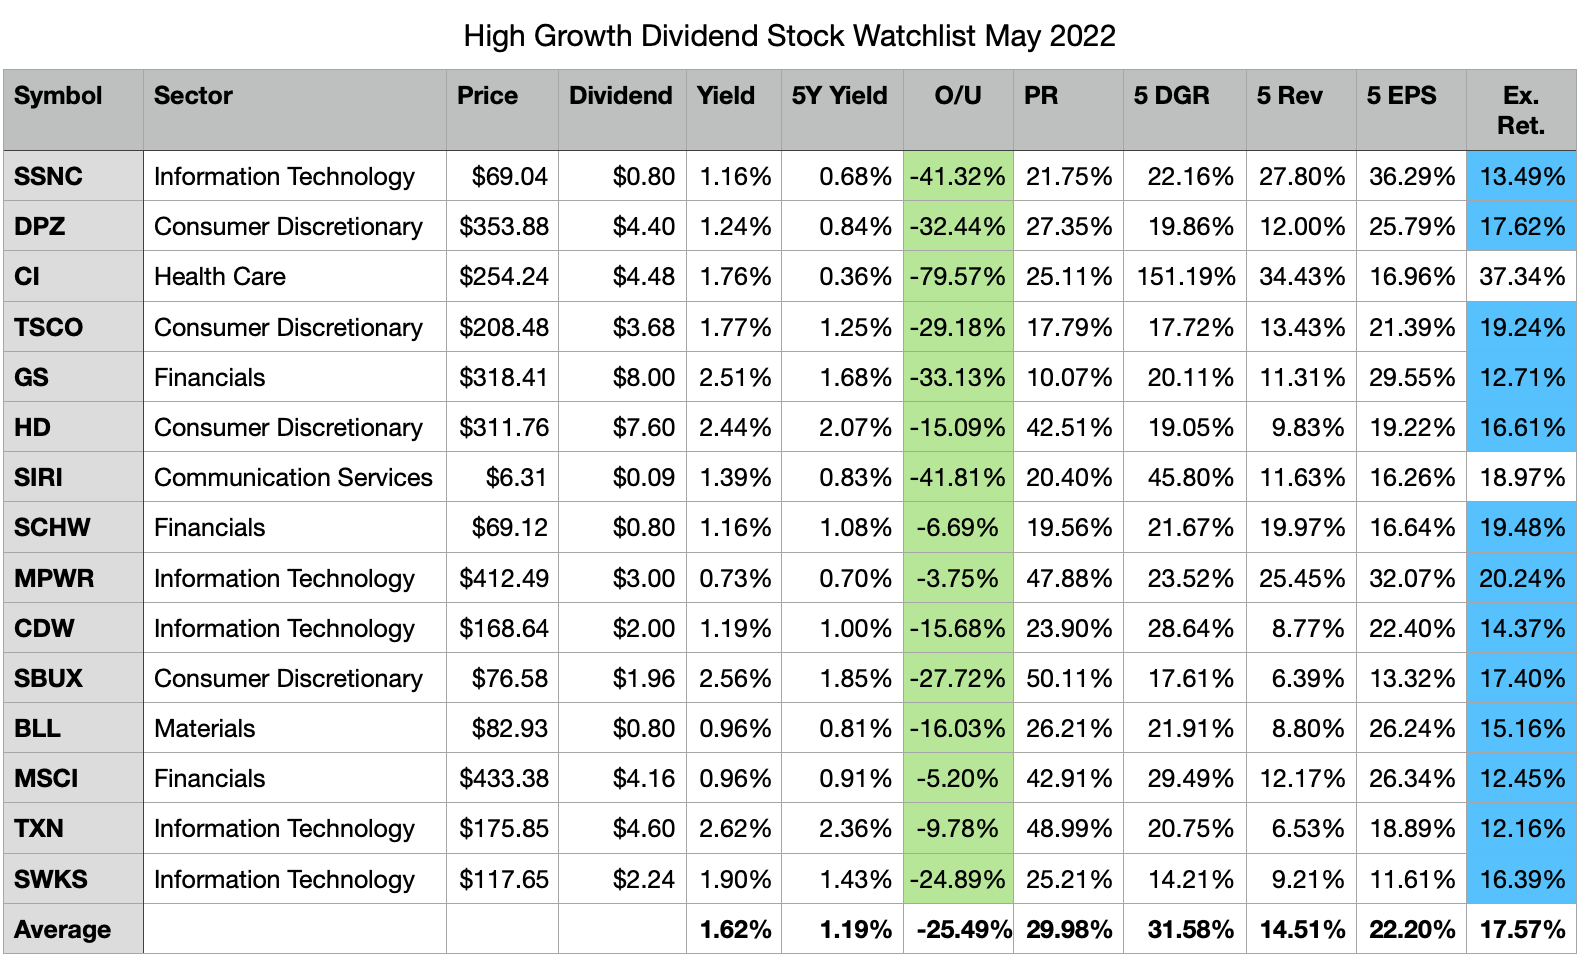
Above are the 15 stocks I am considering for further evaluation during the month. They are sorted in descending order by their rank and 5-year dividend growth rate.
The “O/U” column represents potential undervalue; this is a comparison of the current dividend yield to the historical dividend yield as a function of share price. Collectively these 15 stocks offer a dividend yield of 1.62%.
The expected return in the table above was computed using a discounted 5-year EPS forecast, a return to fair value and the current dividend yield. There is also a margin of safety built into the forecasted return. These figures are just assumptions based on the available data and there is no guarantee these returns will be attained.
The 80% potential undervaluation for Cigna (CI) is obviously inaccurate and a result of accelerated dividend growth during the past two years. Cigna for the longest time paid one annual dividend of 4 cents. In 2021 the dividend policy was adjusted to distribute a quarterly dividend, additionally the dividend rate was increased to $1 per share, and further to $1.12 per share in 2022. This increase drove the dividend yield significantly higher, hence using dividend yield theory to value Cigna will be ineffective in the near future. Dividend yield theory works best for companies with stable and consistent dividend growth.
Past Performance
April was a poor month for the watchlist as it experienced its worst monthly return since inception. The watchlist lost 5.82% underperforming the prior worst month by 0.51% (February 2022 -5.31%). VIG offered a slightly better return in April losing only 5.12% and remains ahead of the watchlist on a year-to-date basis. SPY lost 8.78% in April and is now performing worse than the watchlist on the year. Since inception, the watchlist has a better annualized return, 13.87%, than VIG, 12.38%, and SPY, 11.98%.
|
Month |
Watchlist |
All |
VIG |
SPY |
|
1 Month |
-5.82% |
-9.16% |
-5.12% |
-8.78% |
|
3 Month |
-8.84% |
-9.43% |
-4.99% |
-8.14% |
|
6 Month |
-7.70% |
-12.01% |
-5.48% |
-9.68% |
|
1 Year |
4.43% |
-1.10% |
2.36% |
0.06% |
|
2020 |
6.27% |
6.15% |
9.09% |
7.94% |
|
2021 |
33.52% |
32.60% |
23.75% |
28.56% |
|
2022 |
-12.49% |
-15.76% |
-10.03% |
-12.98% |
|
Since Inception |
24.17% |
18.58% |
21.47% |
20.75% |
|
Annualized |
13.87% |
10.77% |
12.38% |
11.98% |
Top 5 past and present watchlist stocks in April 2022:
- (SHW) +10.15% (present)
- (DG) +6.95% (past)
- (CI) +2.99% (present)
- (HUM) +2.16% (present)
- (MA) +13.34% (present)
April was an interesting month as 4 of the 5 best performing past and present watchlist stocks were amongst the top 15 stock selected in April. In total there have been 62 unique dividend stocks selected by this watchlist since September of 2020.
Top 5 Stocks by Total Return since joining the watchlist:
- ADP (ADP) +62.59% (20 months)
- UnitedHealth Group (UNH) +55.06% (15 months) NEW
- Costco (COST) +44.48% (20 months)
- Tractor Supply (TSCO) +44.27% (15 months)
- Nvidia (NVDA) +39.04% (13 months)
ADP is the new best performing stock on the watchlist as it leaps ahead of NVDA in April, losing only 4.11% during the month. UNH jumps onto the top 5 list, moving into 2nd place after losing only 0.28% in April. COST slides from 5th to 3rd place after losing 7.52% in April. TSCO falls from 3rd to 4th after losing 13.98% in April. NVDA the long term leader slides all the way down to 5th place after losing 32.03% in April.
SCHW drops out of the top 5 list after losing 21.33% in April.
Since not all stocks have been on the watchlist for the full 20 months of its existence, comparing a monthly average return can help normalize the results. Here are the top 5 stocks with the highest average monthly return since joining the watchlist.
- UnitedHealth Group (UNH) +2.97%
- Rollins (ROL) +2.94%
- Nvidia (NVDA) +2.57%
- Tractor Supply (TSCO) +2.47%
- ADP (ADP) +2.46%
UNH takes the lead in terms of best average monthly return on the watchlist after losing only 0.28% in April. ROL lost 4.31% in April and slides down into a close 2nd spot. NVDA holds onto 3rd place even with its dismal showing last month. TSCO sits in 4th place but is just narrowly better than ADP that rejoins the top 5 list.
Drivers Of Alpha
The watchlist did not beat VIG in April. Only 7 watchlist stocks outpaced the ETF last month.
The remaining 8 stocks underperformed VIG.
- (GS) -7.46%
- (CDW) -8.78%
- (SIRI) -9.37%
- (BLL) -9.82%
- (TSCO) -13.68%
- (SWKS) -14.99%
- (DPZ) -16.96%
- (SBUX) -17.95%
Buy-And-Hold Portfolios
This month I am bringing back the buy-and-hold portfolios and I have two to share with you. I started tracking one at the beginning of 2021 and the other at the beginning of 2022. Each portfolio assumes you invest equally amongst the chosen 15 stocks for the given month and never liquidate these positions.
The 2021 B&H portfolio performed poorly in April, losing 8.47%. The cumulative return since January 2021 for the portfolio is 12.29% compared to 11.34% for VIG and 12.04% for SPY. On an annualized basis the portfolio has a 9.09% return compared to 8.39% for VIG and 8.9% for SPY. The portfolio holds 50 unique positions with Lowes and Charles Schwab being the largest. The best performing stock in the portfolio is Northrup Grumman with a total return of 39.45%, the stock has been in the portfolio since January 2021 and capital was added during 6 of the past 16 months.
The 2022 B&H portfolio performed even worse in April, losing 8.71%. The year-to-date return is -15.19% compared to -10.03% for VIG and -12.98% for SPY. The portfolio is not off to a great start but we are only 4 months into the year. There are a total of 31 unique positions in the portfolio due to a high turnover rate on the watchlist because of all the market volatility. The best performing stock in the portfolio is Rollins with a total return of 9.07%, the stock was added to the portfolio in February and no further contributions have been made to this position since.
My expectations are for this watchlist to produce a long term 12%…
Read More: My Top 15 High Growth Dividend Stocks For May 2022


