


-
The EUR/USD wave pattern suggests that a longer and complex chart pattern is expected to take place.
-
The BTC/USD bearish breakout invalidates the expected bullish complex correction of last week.
-
The US30 had again a bearish weekly candle. The high of the candle tested the resistance of the previous weekly high but saw a serious sell off.
EUR/USD complex correction
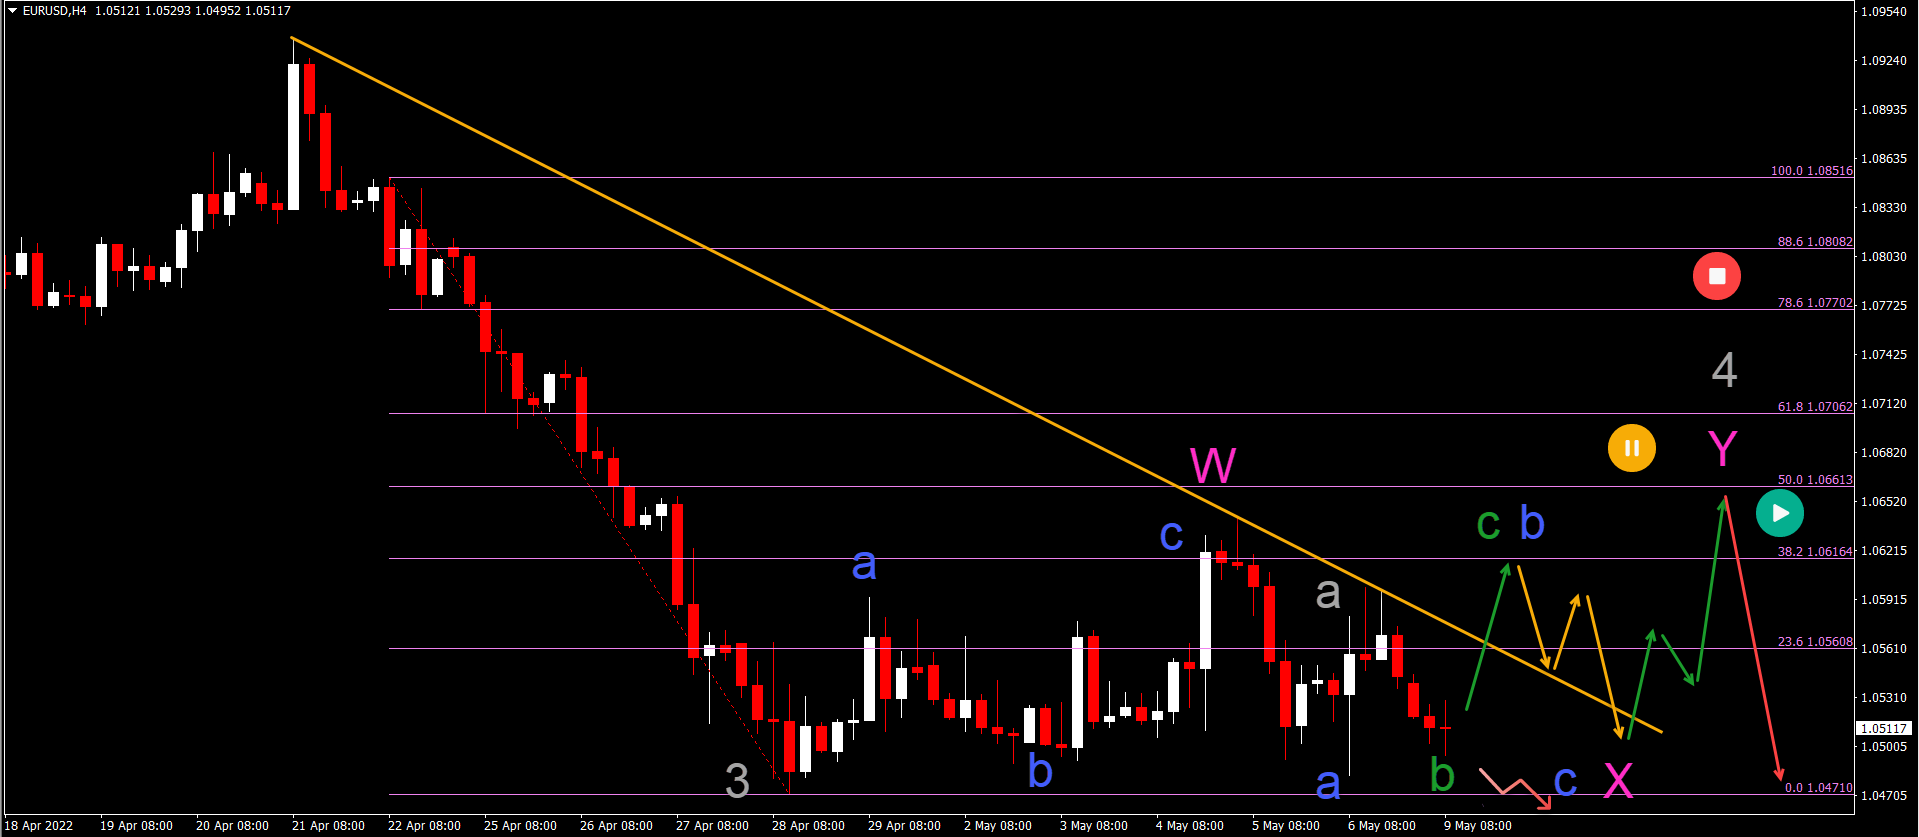
The EUR/USD is testing a key support zone again. The main question is whether the EUR/USD make a bearish breakout:
-
The EUR/USD wave pattern suggests that a longer and complex chart pattern is expected to take place.
-
The downtrend however is expected to remain valid after the correction is completed.
-
A bearish breakout would invalidate the complex correction but confirm the immediate downtrend.
-
If a bullish bounce does occur, then a wave C (green) can develop within wave B (blue).
-
A larger ABC (blue) would finish wave X (pink) of a larger wave Y (pink) of wave 4 (gray).
-
The wave 4 (gray) may not correct above the 50% Fibonacci, otherwise it is likely to actually be a wave 4.
-
Once the downtrend restarts, the main targets are expected 1.0375, 1.0325, 1.025, and even 1.00.
BTC/USD key bearish breakout
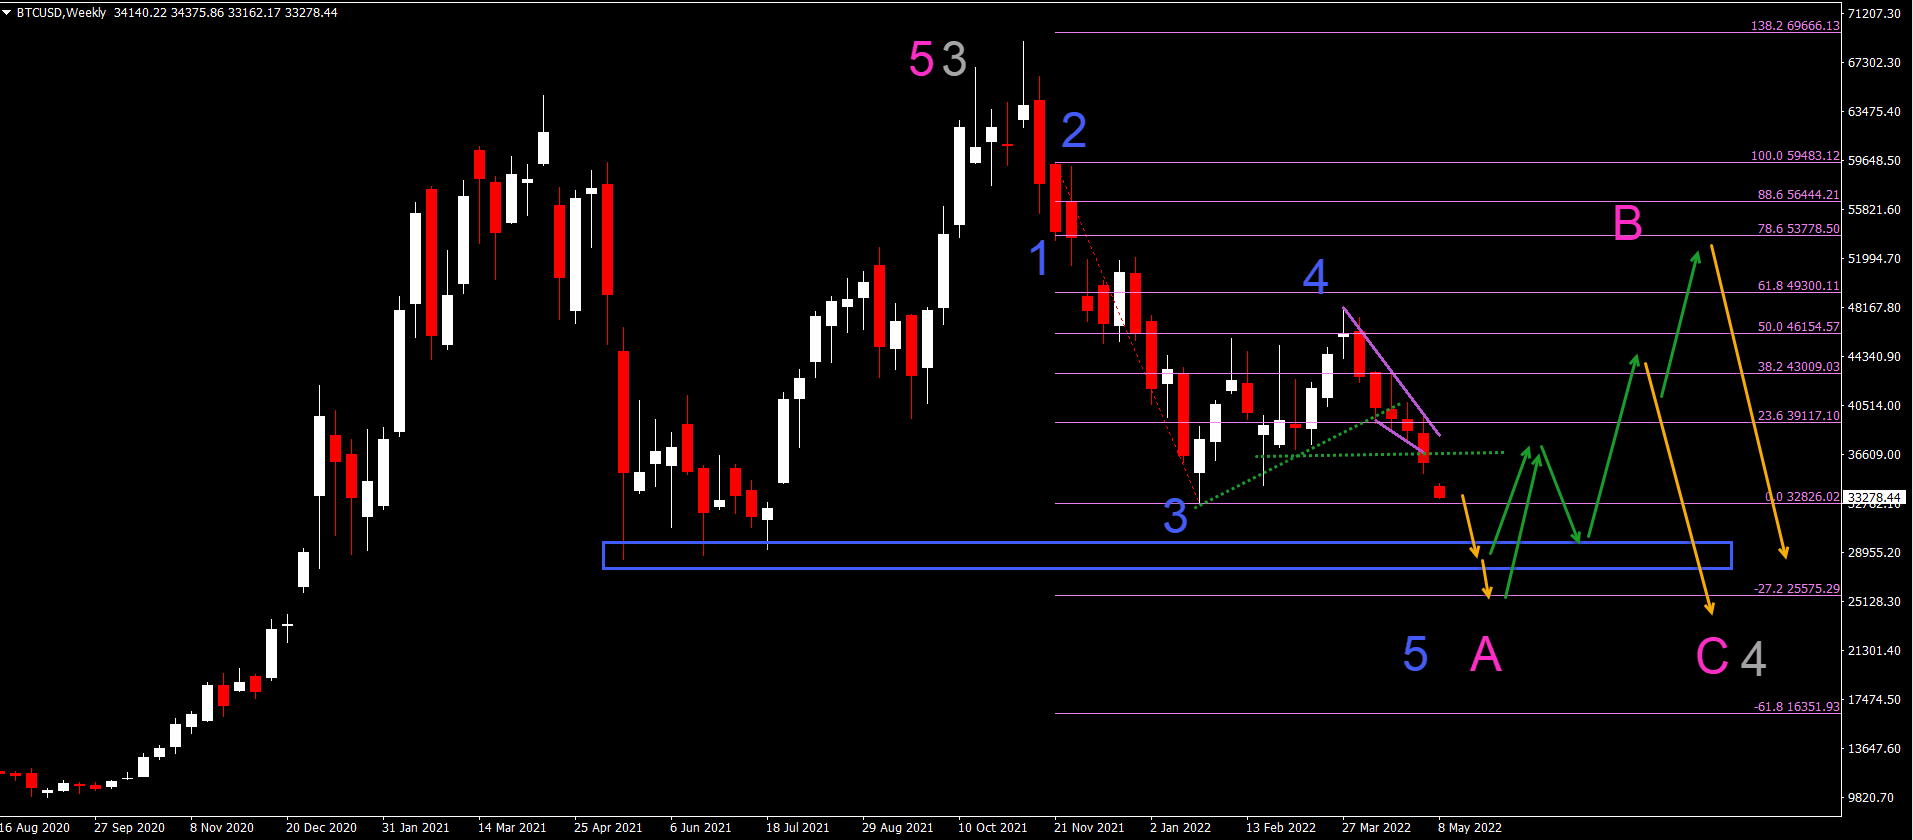
Bitcoin (BTC/USD) has made a bearish breakout and push below the support trend lines (dotted green):
-
The BTC/USD bearish breakout invalidates the expected bullish complex correction of last week.
-
The Elliott Wave analysis has been therefore changed to reflect the new bearish breakout. The current view is a 5 wave (blue) pattern within wave A (pink).
-
A larger ABC (pink) pattern could unfold within a wave 4 (gray) or within a wave W of a larger WXY.
-
The main bearish target of the wave 5 (blue) is the support zone (blue box) or the -27.2% Fibonacci target.
Dow Jones downtrend channel emerges
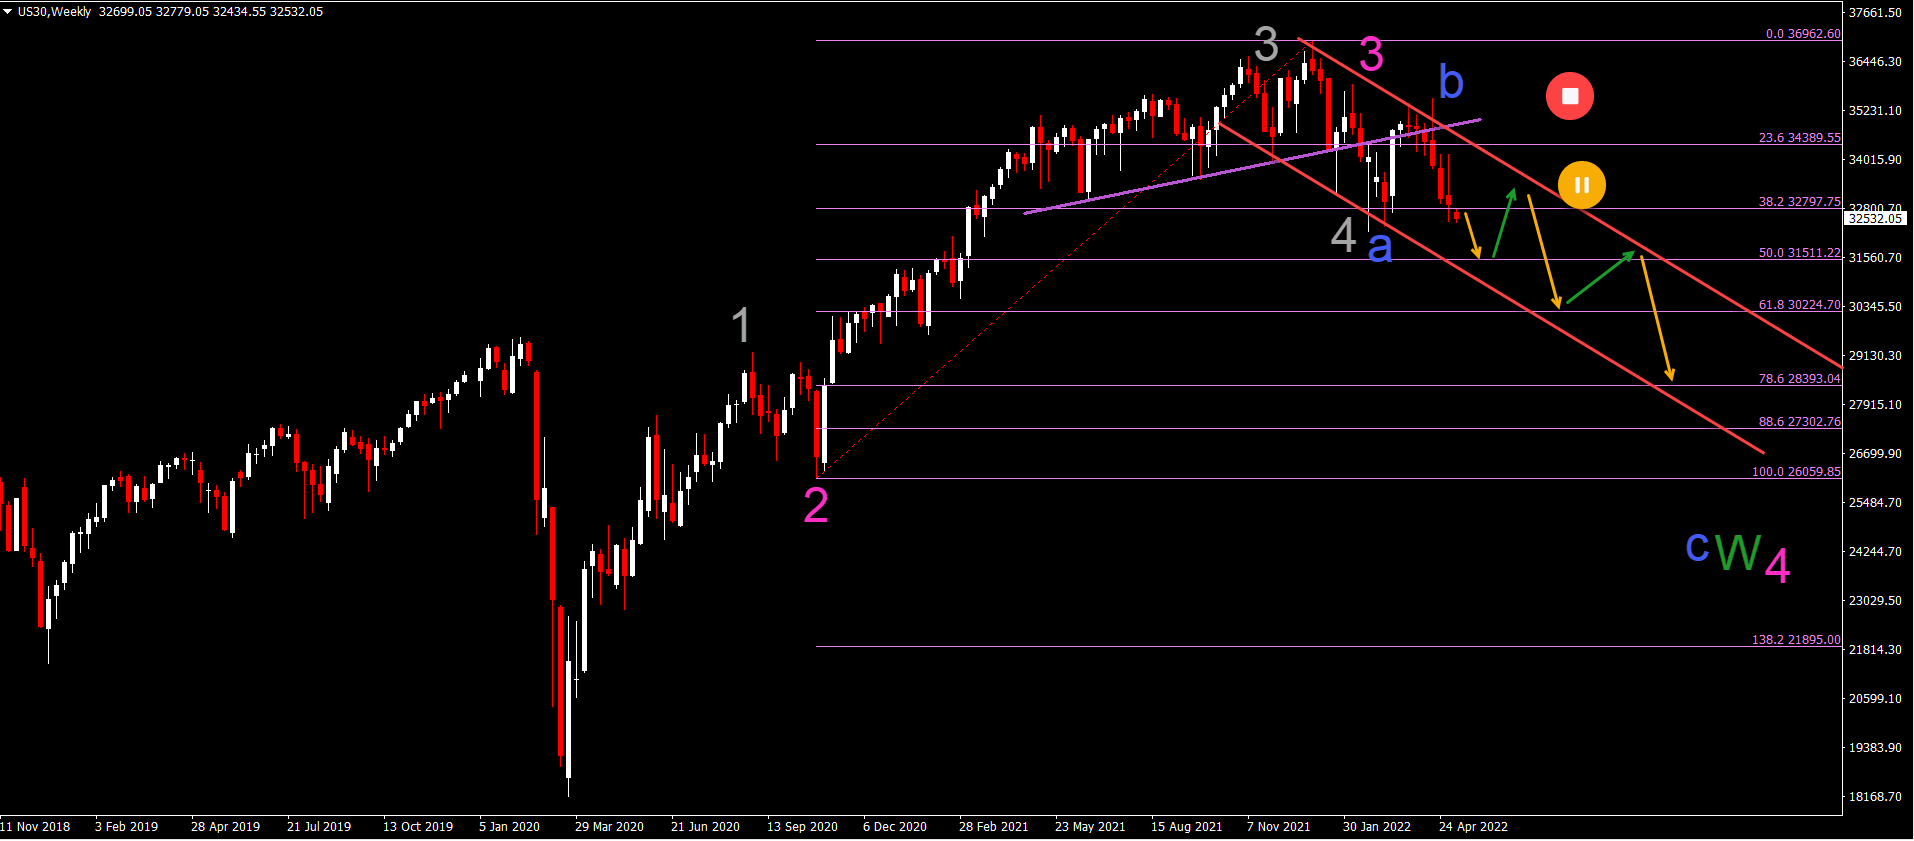
The US30 remains bearish too, as expected in our analysis last week:
-
The US30 had again a bearish weekly candle. The high of the candle tested the resistance of the previous weekly high but saw a serious sell off.
-
A bearish push towards 50% Fibonacci level is now expected (orange arrow).
-
A bullish retracement could take place at the Fibonacci levels (green arrows) but ultimately, a larger bearish retracement is expected.
-
If price action stays above the 50% Fibonacci level, then a wave 3-4 (gray) is still possible.
-
But a break below the 50% Fib indicates a deeper ABC (blue) correction within wave W (green) of wave 4 (pink).
The analysis has been done with the indicators and template from the SWAT method simple wave analysis and trading. For more daily technical and wave analysis and updates, sign-up to our newsletter


