


DNY59/E+ via Getty Images
Co-produced by Austin Rogers for High Yield Investor
What causes a bear market in stocks?
Surely a wide variety of answers could be given that would all be correct. Some examples include:
- Declining economic growth or shrinking GDP
- An economic or geopolitical shock
- Overvaluation
- Rising interest rates
- Downward revisions in earnings estimates
Each of these factors play a role in spurring and fueling a bear market. But in a very literal sense, none of these are what causes a bear market.
Instead, what causes a bear market is a shift in the supply-demand balance for equity shares. It happens when this supply-demand balance shifts from more demand for shares from buyers than supply from sellers and corporate equity issuance to more selling pressure from sellers than demand from buyers or corporate buybacks.
Or, to put it more simply, bear markets happen when more investor money wants to sell than to buy.
In a macro sense, then, bear markets end when selling pressure gives way to buying pressure. Of course, on its own, this point is not particularly useful to investors, because the market always has a reason for having greater buying or selling pressure. But regardless of the particular reason, bear markets are fueled by investor selling, which is in turn fueled by investor fear and panic.
The takeaway for investors, then, is that the cure for bear markets is simply not to panic-sell. Instead, it is crucial during bear markets to remember two things:
- Unrealized losses are not real losses. A paper loss only turns into a real loss when one locks it in by selling.
- Continually buying attractively valued stocks will, in a small way, contribute to ending the bear market.
Don’t feed the bear by panic-selling. Ignore unrealized losses unless your thesis for buying the stock is fundamentally and permanently broken. Buy the attractively valued stocks of good businesses that pay generous dividends and hold them for the long term.
That is our bear market playbook at High Yield Investor. It has served us well in the past, and we believe it will serve investors well in the current downturn as well.
Trading Volume Spikes During Selloffs
In any properly functioning market, there must be a willing buyer and a willing seller. Without the two agreeing on a price, the buyer’s bid price and the seller’s asking price (the “bid-ask spread”) won’t meet, and no transaction will take place.
In a bear market, the investor community becomes gripped by fear and uncertainty. Sellers panic and try to sell stocks at whatever price they can get, fearing that whatever situation spurring the bear market could get exponentially worse. Meanwhile, buyers get nervous and will only buy at lower prices.
How do bear markets end? As prices drop, value investors who have been sitting on cash begin to buy. Lower and lower prices increasingly set off alarm bells for sellers and ring the dinner bell for buyers. Trading volume surges as pessimists collectively sell more and opportunists collectively buy more.
Troughs in stock prices almost always coincide with peaks in trading volume. Consider, for instance, the trading volume of the SPDR S&P 500 ETF (SPY) in the wake of the dot com bubble in 1999-2000. The orange line below shows 30-day average daily volume, which lags actual peaks in daily volume by a few weeks.
Trading volume spikes during previous bear markets (YCHARTS)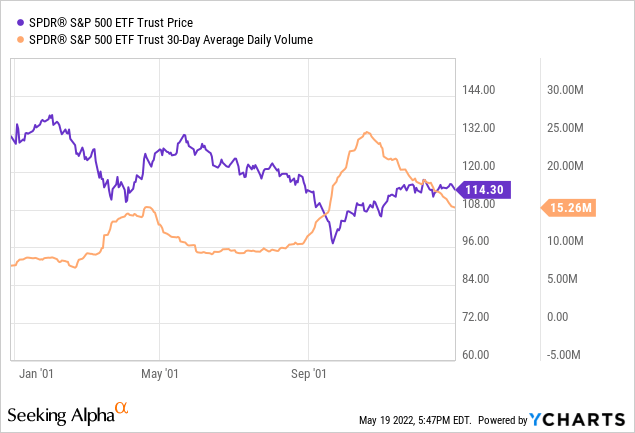
As you can see, stock market bottoms coincided with peaks in trading volume. In other words, the largest numbers of shares are sold right at the trough.
Sometimes, as in the bear market in 2000-2001, we find a short-term bottom followed by a rally to a lower high, then a further selloff to an even lower bottom. In such a case, trading volume may surge even higher in the deeper selloff than the shallower selloff.
Or, as in the case of the financial crisis in 2008-2009, trading volume may surge highest in the initial selloff (Fall 2008) only to rise to a lower high during the final, capitulation selloff (Spring 2009).
Trading volume spikes during previous bear markets (YCHARTS)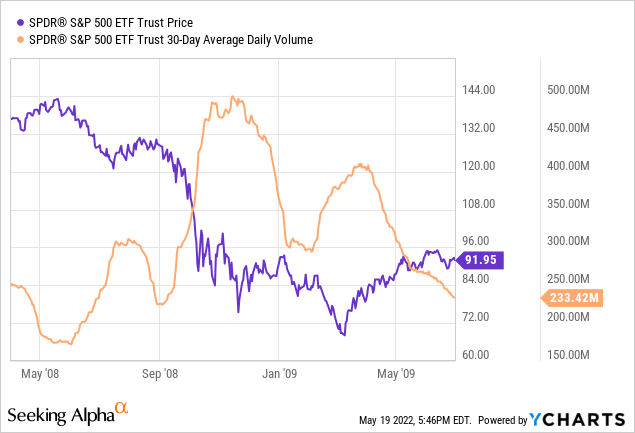
Other times, such as in the early stages of the COVID-19 pandemic and related lockdowns in March-April 2020, trading volume soars to a peak coinciding with the bottom in stock prices, then eases back toward a more normal level of transaction volume.
Trading volume spikes during previous bear markets (YCHARTS)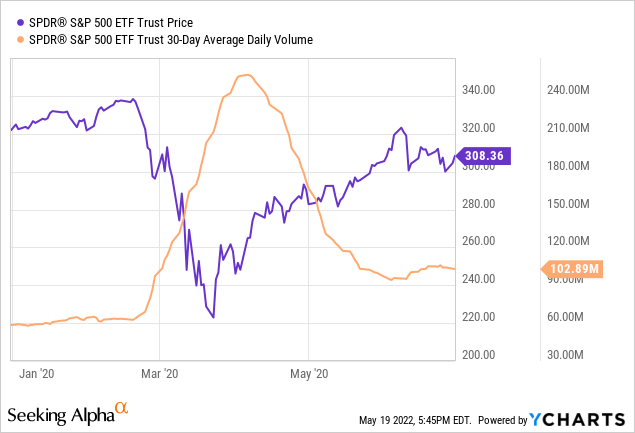
The pattern, as you can see above, forms a sharp mountain peak and typically occurs around the sudden onset of a largely unforeseen, black swan-type economic shock.
What about our current market selloff? As we find below, volume surged from mid-January to the beginning of March, then eased sharply as the S&P 500 index temporarily rallied. Now the trend in volume is on its way back up as the market sells off further.
Trading volume spikes during previous bear markets (YCHARTS)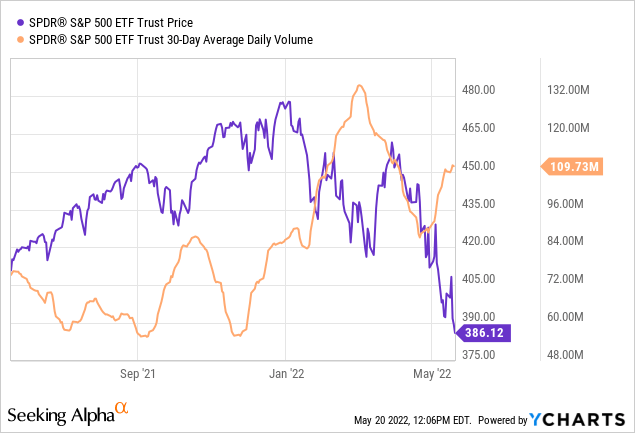
Will we see a 2001-style pattern of higher volume in the second downturn than the first? Or a 2008-2009 kind of pattern in which the initial surge in volume is highest while the second is lower, resulting in the final capitulation before a new bull market is born?
Or will it be a third option, wherein the bear market grinds on for a long time with various peaks in volume and troughs in stock prices?
The answer is beyond our pay grade. In fact, it’s beyond anyone’s pay grade. Many market pundits will posit the S&P 500 level at which the bear market will end. Some will come close, while others will be way off. It’s impossible to tell in advance which pundits are which, especially without clarity on the inflation outlook or how high the Fed will take interest rates.
Instead of trying to time the market, we recommend returning to the tried-and-true bear market playbook discussed previously:
- Don’t feed the bear by panic-selling.
- Ignore unrealized losses unless your thesis for buying the stock is fundamentally and permanently broken.
- Buy the attractively valued stocks of good businesses that pay generous dividends and hold them for the long term.
The question of why to focus on dividend-paying stocks is beyond the scope of this article, but we have written about the benefits of a dividend investment strategy elsewhere.
For now, we highlight two solid businesses with high-yielding dividends that should be able to weather any storms in the economy or capital markets ahead.
1. Cogent Communications (CCOI)
cogent communications logo (Cogent Communications)
CCOI is an Internet service provider and telecommunications company that facilitates around 20% of all Internet traffic in the United States. The primary customers of CCOI are big corporations and businesses that office in urban high-rise buildings.
Since employee traffic in office space dropped significantly during the pandemic, CCOI took a hit, both in revenue and investor sentiment. Despite an impressive dividend growth streak over the last 39 consecutive quarters, investors have worried that permanently lower office space usage will impair CCOI’s ability to grow.
But the good news for CCOI is that office occupancy continues to slowly but surely rebound. Using Kastle Systems’ “Back To Work Barometer,” we find that most major office markets are seeing office usage steadily increase.
return to the office barometer (Cogent Communications)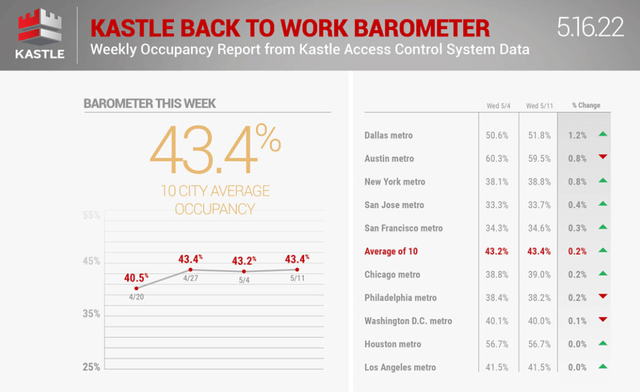
While the future of work, namely the balance of remote and in-person office work, remains up for debate, the “return to the office” trend seems poised to continue for the foreseeable future. With Kastle’s 10-city average office occupancy still under 50%, there remains plenty of upside for office usage as well as office Internet traffic.
Moreover, as more workers work remotely, there may ultimately be increased data usage to accommodate more teleconferencing.
And CCOI is undeniably cheap by a number of measurements. For example, by price to operating cash flow (or “cash from operations”), CCOI is cheaper than it has been any time since mid-2013.
Cogent Communications is historically cheap (YCHARTS)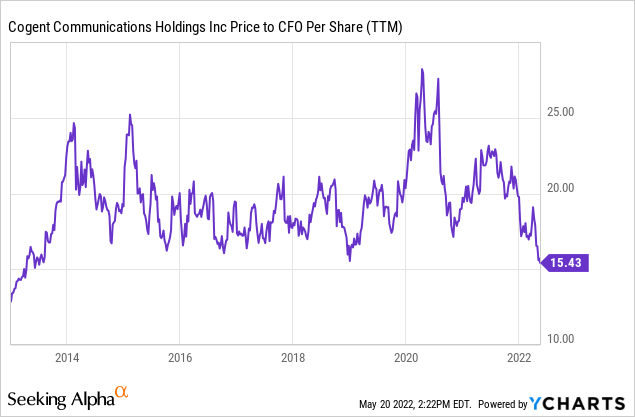
Likewise, by enterprise value to EBITDA, CCOI hasn’t been this cheap since a dip in early 2019.
Cogent Communications is historically cheap (YCHARTS)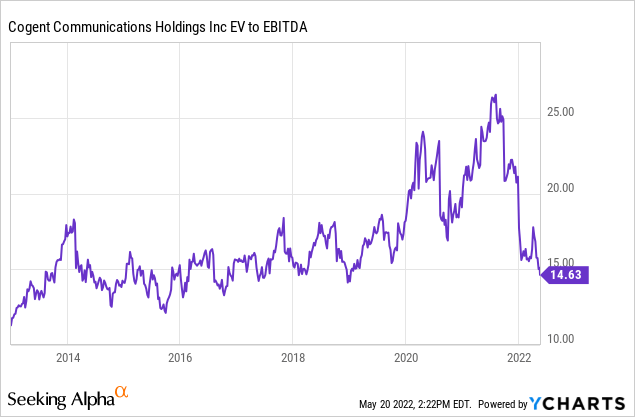
Moreover, CCOI enjoys a highly motivated and shareholder-aligned management team, led by 20+ year CEO Dave Schaeffer. They are as incentivized to keep the dividend growth streak going as the ordinary shareholder.
The current yield is 6.2% and we expect 30% upside.
2. Verizon Communications (VZ)
Verizon logo (Verizon )
VZ scarcely needs an introduction. The telecommunications giant boasts the fastest nationwide cellular network as well as the most investment into its 5G rollout of any mobile provider. Despite being a perennially slow grower, VZ hopes to generate increased revenue growth by upselling its customers on premium plans with 5G access.
Both VZ and its major competitor AT&T (T) have announced price hikes recently, but the market rightly worries that these providers won’t be able to raise prices commensurate with the CPI. What’s more, VZ no longer has the “Warren Buffett seal of approval,” as Berkshire Hathaway (BRK.B) sold over 99% of its VZ position in the first quarter of this year.
But investors should not buy VZ for high growth. If they do, they are sure to be disappointed. Instead, the value of VZ is found in its stability and its income.
Since we use our cell phones for everything nowadays, the cell phone bill is one of the last payments consumers will stop making when money is tight. As such, VZ’s revenue is remarkably stable. That translates into high stock price stability and low beta (volatility compared to the S&P 500).
Verizon is a low beta stock (YCHARTS)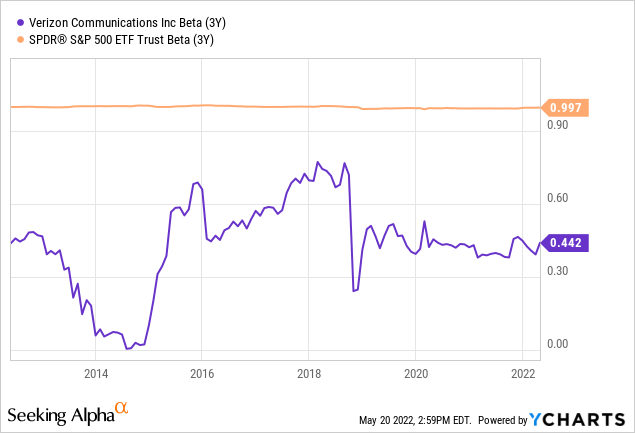
Having a beta of 0.44 means that, on average, VZ’s price movement corresponds with that of the broader market only 44%.
Likewise, when the market sells off, VZ tends to sell off significantly less. This was the case during the sharp selloff at the beginning of COVID-19:
Verizon is a low beta stock (YCHARTS)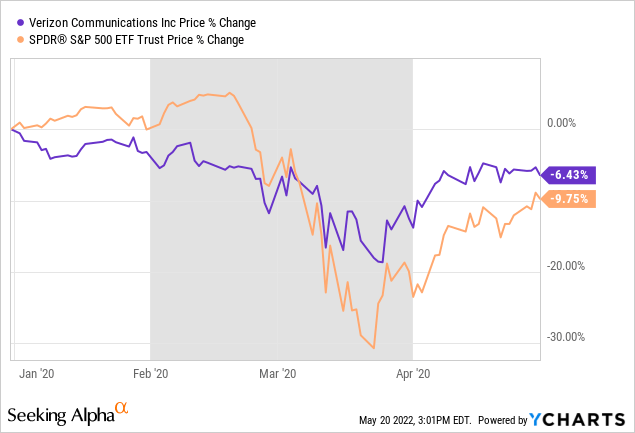
And it…
Read More: Don’t Feed The Bear: 2 Top Stock Picks To Ride Out The Storm


