


Mario Tama/Getty Images News
Investment Thesis
Costco Wholesale Corporation (NASDAQ:COST) saw its stock battered as it fell 16% from the previous week. While the sell-off was brutal for a defensive stock like COST, we argued in our previous article (Sell rating) that the writing was already on the wall.
A massive bull trap that had formed in April presaged the significant markdown. Therefore, we told investors to get out before more pain could befall COST investors.
Our price action analysis suggests a near-term bottom as it hobbles around its current support level. However, we think the stock is still well overvalued relative to its sector mean. Therefore, we believe a massive de-rating on COST stock is still underway, even though there could be a near-term rebound due to oversold technicals.
But, we don’t see a re-rating of COST stock in the near term, as we think the consensus estimates remain too optimistic (23 Buy ratings out of 29). Moreover, a closer inspection of COST stock in previous deep retracements suggests a fall to 22-25x NTM normalized P/E is not unreasonable before an eventual bottom.
COST stock last traded at an NTM normalized P/E of 30.52x, with a significant premium. Therefore, we reiterate our Sell rating on COST stock. Don’t hold the bag to the bottom.
COST Stock Was Very Expensive. Now It’s Still Expensive
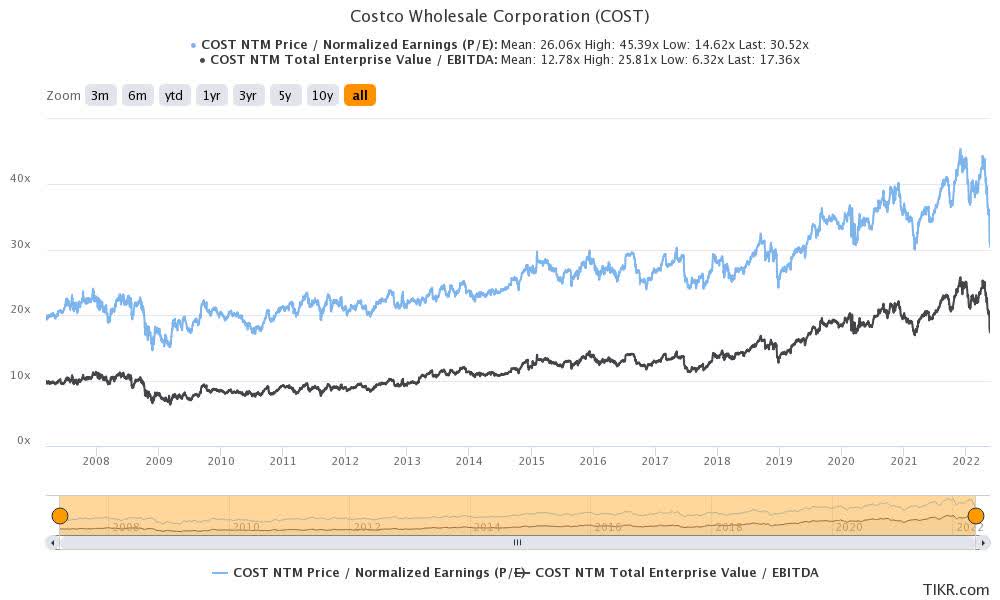
COST stock NTM normalized P/E (TIKR)
In our previous articles, we cautioned investors that COST stock’s valuations were peaking. We couldn’t see how the company could continue to sustain its peak valuations, even though growth could be slowing. But the April bull trap validated our thesis that the dominoes could start to fall steeply.
Despite the significant markdown, COST stock still traded at an NTM normalized P/E of 30.52x. It’s still way above the consumer staples sector NTM P/E of 21x. The market has justifiably de-rated COST stock ahead of its FQ3 earnings on May 26. But, the sell-off had already started in April, as the market digested its unsustainable gains from 2020-22.
A closer inspection of COST stock’s previous deep retracements suggests that more pain could lie ahead. For instance, COST stock’s P/E went as low as 15x in November 2008. In November 2016, it fell to 25x, while in October 2017, it fell to 24.5x. Then in the 2018 bear market, it also fell to 25x. Therefore, COST investors shouldn’t be surprised if the market continues to force an eventual bottom at a lower valuation than its current 30x NTM P/E.
Price Action Suggests A Near-Term Bottom – But Not Likely To Hold
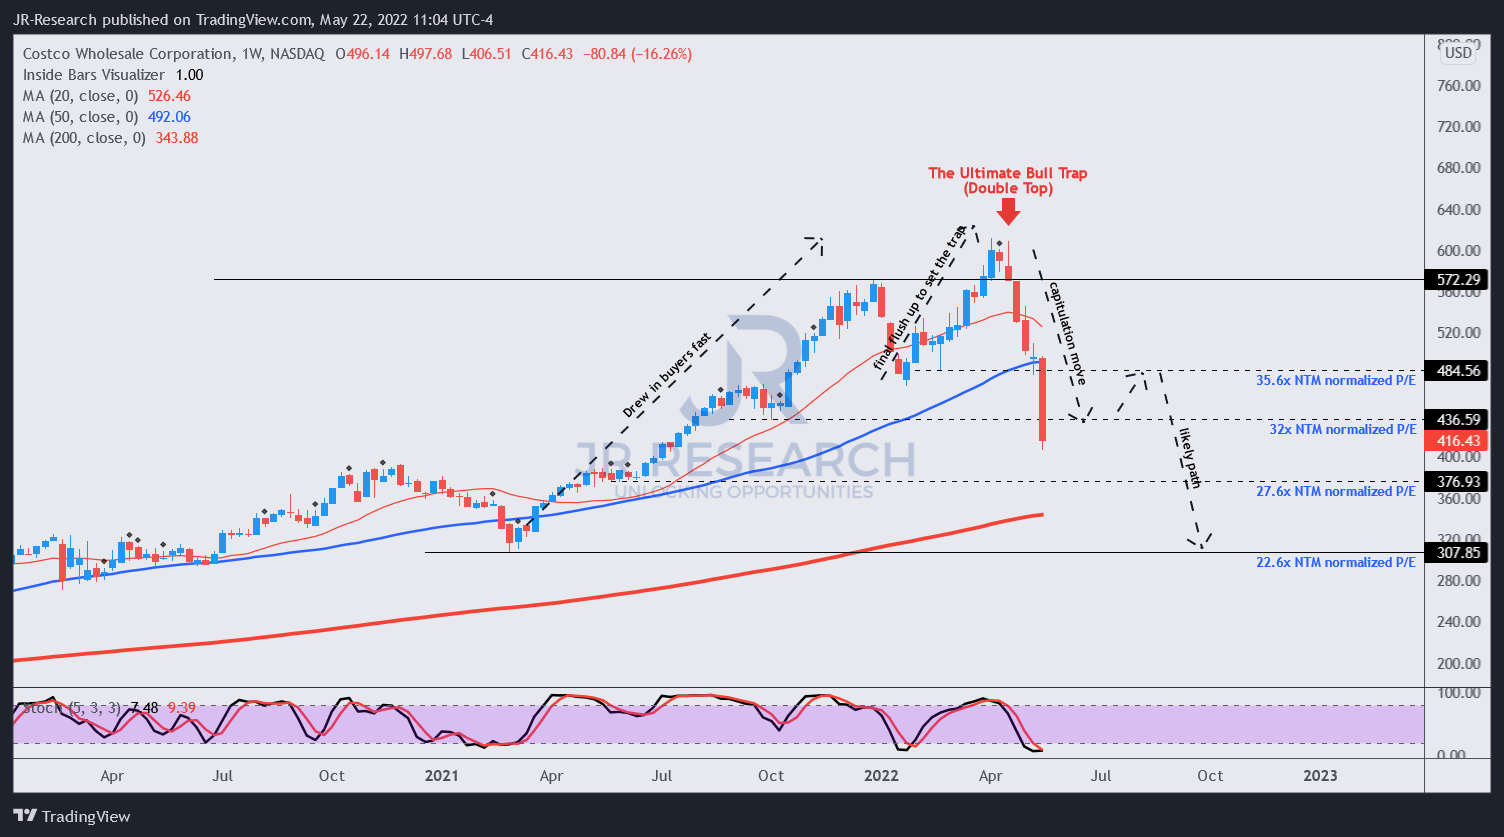
COST stock price chart (TradingView)
COST stock is likely at a near-term bottom, given its oversold technicals. However, the stock has fallen well below its 50-week moving average for the first time since February 2021. The stock made a robust recovery in February 2021 that set the stage for its massive upward move to April 2022 (a move to draw in buyers rapidly for the bull trap). The stock also traded at 30x NTM normalized P/E at its bottom in February 2021.
However, we think the macro conditions have changed dramatically. The US consumer outlook is also getting weaker. In addition, we believe that the US housing market could also be peaking, weakening the consumer outlook further. Therefore, we couldn’t justify COST stock bottoming at 30x P/E moving forward.
Looking back to December 2018, COST stock also fell below its critical 50-week moving average before recovering. However, as mentioned earlier, it reached its nadir with a P/E of 25x.
Is COST Stock A Buy, Sell, Or Hold?
We think COST stock could stage a rebound into the $485 resistance level before falling further. We see a potential eventual bottom near the $310 level (NTM P/E: 22.6x), implying a downside of up to 25% from the current levels.
Accordingly, we reiterate our Sell rating on COST stock. Instead, investors should use any potential short-term rebound or “dead cat bounce” to lighten exposure partially or fully. Catch this general at $310.
Read More: Costco Q3 Earnings Preview: Don’t Fall With It Any Longer (NASDAQ:COST)


![Just released: the 3 best small-cap stocks to buy right now [PREMIUM PICKS]](https://thedailystock.news/wp-content/uploads/2023/01/GardenFun-350x250.jpg)


