


Andrii Dodonov/iStock via Getty Images
Written by Nick Ackerman, co-produced by Stanford Chemist. This article was originally published to members of the CEF/ETF Income Laboratory on May 22nd, 2022.
Fixed-income funds have been taking some massive losses this year. These are supposed to be the safer options relative to equities. However, after years of near-zero interest rates, the Fed is primed to raise rates aggressively to temper inflation. That has put added pressure on yields across the board.
One area that is particularly subject to interest rate sensitivity is municipal bonds. Muni bonds are generally investment grade with longer maturities, resulting in higher durations. At this point, though, the prices have come down considerably, and the yields on muni funds are starting to get interesting now.
One fund to gain exposure to this area of the market is RiverNorth Managed Duration Municipal Income Fund (NYSE:RMM). They take a unique approach to investing through two different managers with two different strategies. RiverNorth manages a sleeve of the portfolio, investing in other closed-end funds – a fund of funds approach. There is also MacKay Shields that manages a sleeve of the assets and invest in individual muni bonds.
At this time, they are positioned in a “neutral CEF environment” weighting.
RMM CEF Environment (RiverNorth)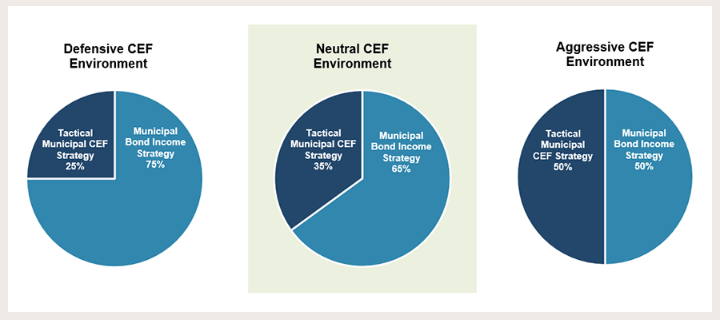
The more exact weighting at the end of March 31st, 2022, was 67% muni bonds and 33% muni funds. Interestingly, this was around the same weighting when we took a look last year. At that time, CEFs were much more richly priced.
In fact, the fund’s discount at that time was only 1.21%, which made it quite richly priced too. This has come down now, along with the underlying positions in the portfolio, making it a much more tempting offer. However, there are risks to consider that we will also touch on.
The Basics
- 1-Year Z-score: -1.21
- Discount: -6.26%
- Distribution Yield: 7.50%
- Expense Ratio: 2.17%
- Leverage: 40.46%
- Managed Assets: $602 million
- Structure: Term (anticipated liquidation date July 25th, 2031)
RMM’s investment objective “seeks to provide current income exempt from regular U.S. federal income taxes with a secondary objective of total return.” As we pointed out previously with RMI, they use a national approach. Therefore, state taxes would still largely apply except for what allocation is derived from your home state.
To achieve this, they utilize an approach depending on the CEF environment, as we touched on above. If they are more defensive in the CEF space, they will have a smaller allocation. At the same time, if values in the CEF space are enticing, they will bring the portfolio up to a 50/50 approach between CEFs and individual muni bonds. I would be curious to see now that CEF valuations are opening up if they will shift heading through this year. We already saw that they didn’t shift when CEFs were expensive last year.
Now, here are a couple of the risks to consider. The fund itself isn’t overly large when you factor out the fund’s leverage. It came in at $358.4 million in their Fact Sheet. That has come down since that was at the end of Q1 2022. The fund carries a significant amount of leverage and restricts themselves to “no greater than 45%.”
It is a muni fund, so high leverage can be okay. However, since they also hold other CEFs, those CEFs carry leverage too. Even if some leverage is okay since it is muni holdings, we are then applying leverage on leverage. That can make the fund more erratic and volatile compared to other CEF muni funds.
Speaking of the fund on fund approach, that brings up the fund’s expense ratio. It comes to a high of 2.17%, and it comes to 2.54% when including leverage. Again, if we include the expense ratio of the underlying funds, it would be even higher. That means they certainly have to make some great selections to overcome these high expense ratios.
Performance – Attractive Discount
The bright side of a fund of funds approach on a sleeve of the portfolio is the discount on discounts. At the end of March 31st, 2022, they stated that the average discount of the CEF portfolio came to -7.2%. I couldn’t imagine that this has been reduced too much with the continued volatility. On top of this, the fund is at a fairly attractive discount itself.
YCharts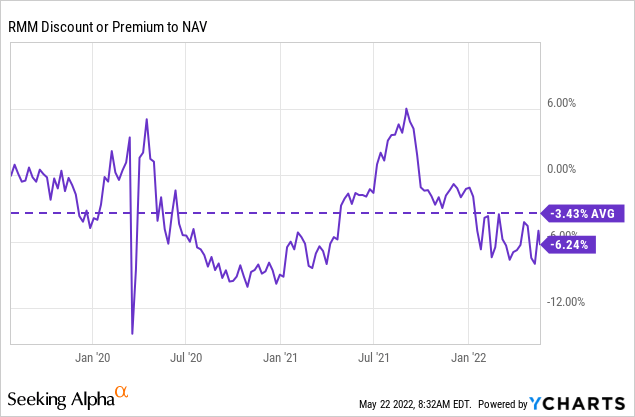
The fund launched in the middle of 2019, so it doesn’t have too much of an extended history. What history we do have, though, puts the average discount at 3.43%. Relative to where the fund is trading now, it makes it appear cheap.
Below is a look at the performance between RMM and iShares National Muni Bond ETF (MUB) since RMM’s inception. It helps highlight how much more volatile RMM is due to its leverage and CEF sleeve. As volatility in the stock market kicks up, we generally see CEF discounts/premiums also gyrate around meaningfully.
YCharts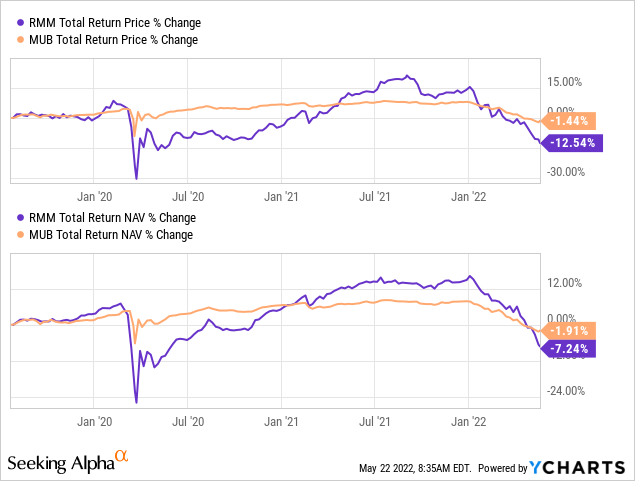
Overall, during the period since the fund launched, it hasn’t been a great time. They had to contend with the 2020 pandemic shortly after being launched and now getting crushed by higher interest rates.
One thing that is interesting to note is that if we stripped out the leverage from RMM, it should decline less. The reason for this is that MUB carries a duration of 6.49 years, and RMM has an estimated hedged duration of 5.61 years. All else being equal, it would mean that higher interest rates would push MUB down further.
Distribution – Managed 5.5% Plan
Similar to the other RiverNorth funds, they carry a managed distribution plan. That means they will reset annually to this amount, no matter if it is being earned or not. For RMM, that is a 5.5% rate set on the final trading day of the calendar year. The fund held steady through 2020 and 2021. Investors then saw an increase in 2022.
RMM Distribution History (CEFConnect)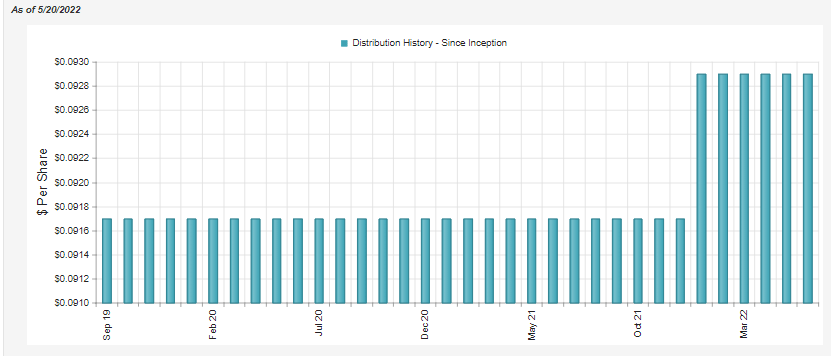
Where things stand now, if it were adjusted today, it would be reduced as the distribution rate on the NAV currently stands at 7.03%.
Below we can see that there is a significant gap in coverage from net investment income to what was actually distributed to shareholders.
RMM Annual Report (RiverNorth)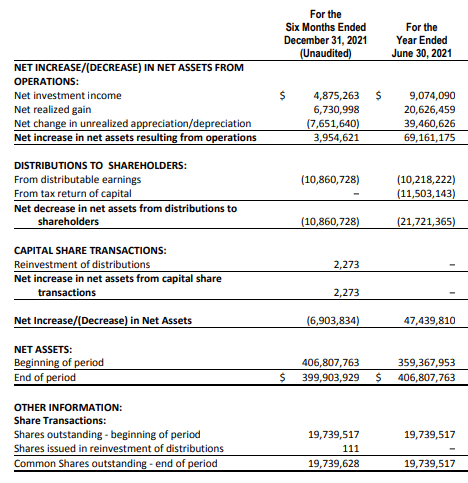
One of the reasons for this comes back to the significant expense ratio. The fund’s actual total investment income was almost $10 million. Over half of it is reduced due to the $5.124 million in expenses on the fund. This highlights why they have to be successful in managing the fund. It will require significant capital gains to keep from eroding the fund.
That being said, for tax purposes, it is still tax-friendly. The distribution has been split mostly between return of capital and exempt-interest dividends.
RMM Tax Classifications (RiverNorth)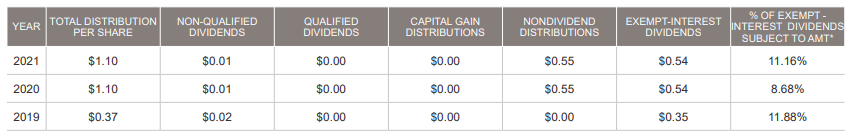
Return of capital can be tax-friendly as it defers taxes until the position is sold. This is done because every ROC distribution reduces the cost basis. This can change from year to year, quite drastically too. So that is always something to watch closely. Unfortunately, the official tax classifications are never known until after the end of the year.
RMM’s Portfolio
The fund’s turnover was last reported at 13% for the last six months for the period ending December 31st, 2021. That means they are somewhat active in moving positions around. That being said, the allocations of the fund haven’t changed too meaningfully since our look last year.
Additionally, the fund’s duration comes to the 5.61 years highlighted above. That was an increase from the 4.10 years they had estimated last year. Since the portfolio is dominated by investment-grade positions, it isn’t too surprising to see a high duration.
RMM Credit Quality (RiverNorth)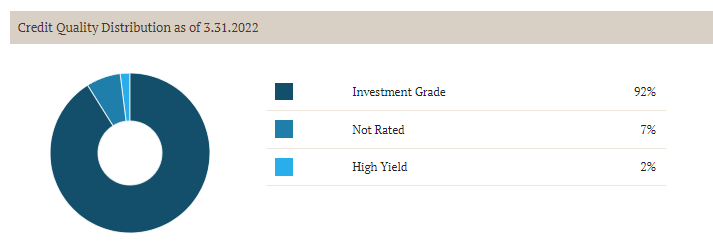
However, when they estimate the unhedged duration, that would actually come in around 9.46 years. Meaning that for every 1% change in interest rates, the fund’s underlying portfolio would be expected to lose 9.46%. Move interest rates to 4% or 5%, which would mean massive losses. So at least in that regard, the hedged part is quite important to preserve some capital.
This high-quality portfolio could also mean more protection when we slip into the next recession. In total, CEFConnect puts the number of holdings at 77. Since the fund holds other CEFs, we know that the actual exposure is significantly higher.
For the top positions, we see the same names as last year.
RMM Top Five (RiverNorth)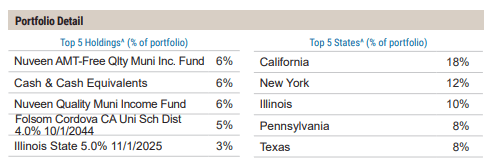
Nuveen AMT-Free Quality Municipal Income Fund (NEA) is the largest. This is then followed by cash – which came up one position. Nuveen Quality Municipal Income Fund (NAD) is then the third largest (or second largest if you disregard the cash position.) Then it is the Folsom Cordova CA UNi School District 4% and Illinois State 5% – exactly the same positions as last year.
NEA and NAD are two of the largest CEFs overall in terms of managed assets. Of course, helping this is the high amount of leverage they use, 42.28% and 41.77%, respectively. Remember, this is on top of RMM’s 40% of leverage too.
CEFConnect shows that NEA holds 1,376 positions and NAD holds 1,353. I’m sure there is significant overlap here, but it just goes to show how much exposure is really in RMM for shareholders in the fund.
NAD and NEA are both right near the lows of the year in terms of their discounts. That is something that RMM’s NAV has had to digest.
YCharts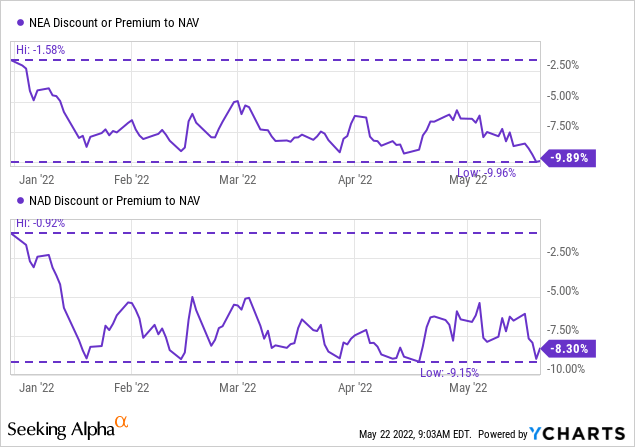
When looking at the performance of RMM, NEA and NAD – we actually see quite similar results on a YTD basis.
YCharts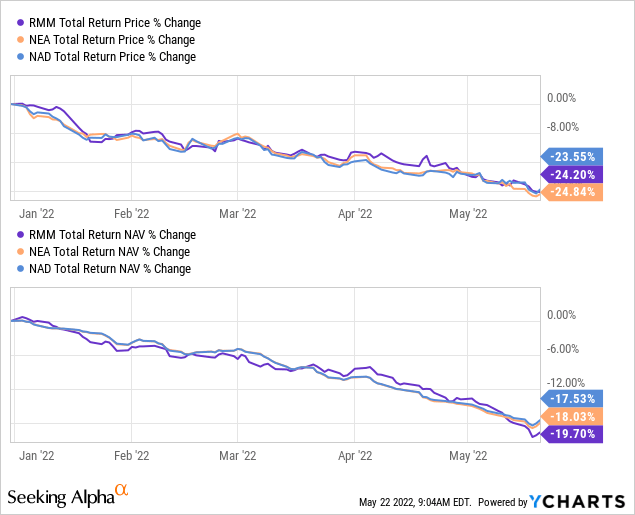
RMM has slightly underperformed. That could be due to higher expenses but also having to account for the larger price declines that NEA and NAD are showing. That puts pressure on RMM’s total NAV return, but of course, the actual share price of NEA and NAD doesn’t impact their own total NAV returns.
Conclusion
RMM is certainly at a more interesting valuation than where it was last year. The fact that CEF discounts have widened out across the board also bodes well for this fund as they have a sleeve of other CEFs. However, the higher expense ratios mean that RiverNorth has to perform at the top of its game. They certainly are a…
Read More: RMM: A Unique Approach To Muni Investing (NYSE:RMM)


![Just released: the 3 best small-cap stocks to buy right now [PREMIUM PICKS]](https://thedailystock.news/wp-content/uploads/2023/01/GardenFun-350x250.jpg)


