


tiero/iStock via Getty Images
It’s been a horrific start to the year for stocks in general, but especially tech stocks.
According to Bloomberg 2/3 of the S&P 500 is in a bear market, and half of the Nasdaq is down 50% or more.
Ycharts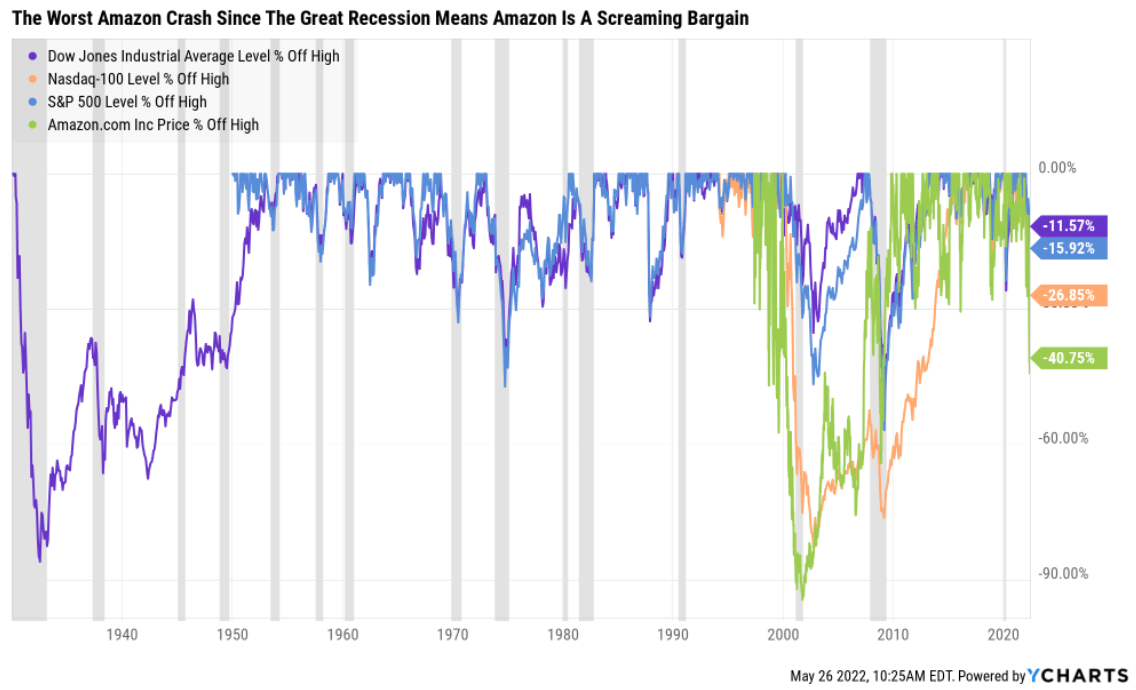
Amazon (NASDAQ:AMZN), a quintessential hyper-growth Ultra SWAN is down 41% of its highs, the worst crash since the Great Recession.
- the lowest valuation in seven years
Naturally, Amazon shareholders want to know when the bottom will finally arrive and when it’s time to back up the truck on this legendary growth stock.
While I can’t tell you with confidence when Amazon will finally stop crashing, I can tell you with 80% confidence, that there are five reasons now is almost certainly the time to start buying Amazon more aggressively.
So let’s take a look at the five reasons the market is dead wrong to be so bearish on Amazon and why now might be the time to back up the truck on one of the greatest growth stories in history.
Reason One: Technical Analysis Has Good News For Amazon Bulls
I’m not a technical focused analyst but Amazon did recently bounce off medium strength support, potentially indicating a short-term bottom.
Tradingview.com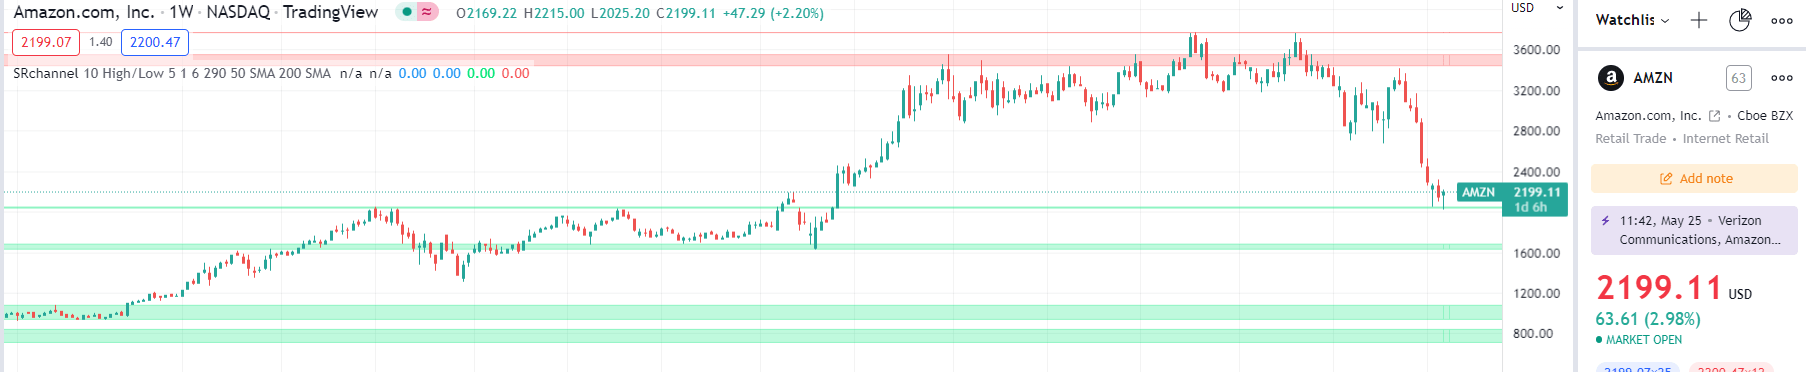
Whether or not it continues to lower lows will depend on the broader market and economic conditions, but Amazon’s crash could be nearing its end.
StockTA.com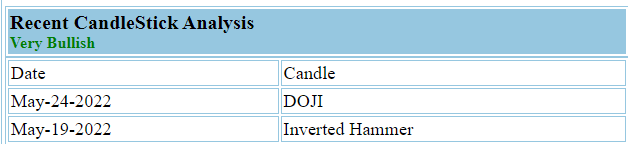
Recent short-term TA indicators are also becoming bullish, further giving support to the thesis that the worst MIGHT be behind Amazon’s share price.
But of course, I don’t recommend any blue-chip to try to score a quick gain, but to help you retire in safety and splendor.
And that is something Amazon can most assuredly do.
Reason Two: Amazon Is The Whole Package
Here’s the bottom line upfront on Amazon.
Reasons To Potentially Buy AMZN Today
- 97% quality medium-risk 13/13 Ultra SWAN hyper-growth company
- 100% balance safety score
- 45% undervalued (potential ultra value strong buy)
- Fair Value: $3,921.06 (26.0X operating cash flow)
- 14.3X forward cash flow vs 25X to 27X historical
- 15.6X cash-adjusted earnings
- AA stable outlook credit rating =0.51% 30-year bankruptcy risk
- 52nd industry percentile risk management consensus = average
- 19.1% to 40.5% CAGR margin-of-error growth consensus range
- 4.9% to 36% CAGR individual analyst growth range
- 21.7% CAGR median growth consensus
- 5-year consensus total return potential: 34% to 39% CAGR
- base-case 5-year consensus return potential: 37% CAGR (12X S&P consensus)
- consensus 12-month total return forecast: 70% (24.2X OCF, reasonable)
- Fundamentally Justified 12-Month Returns: 82% CAGR
Amazon’s biggest crash since the Financial Crisis has created the lowest valuation in 7 years.
Fast Graphs, FactSet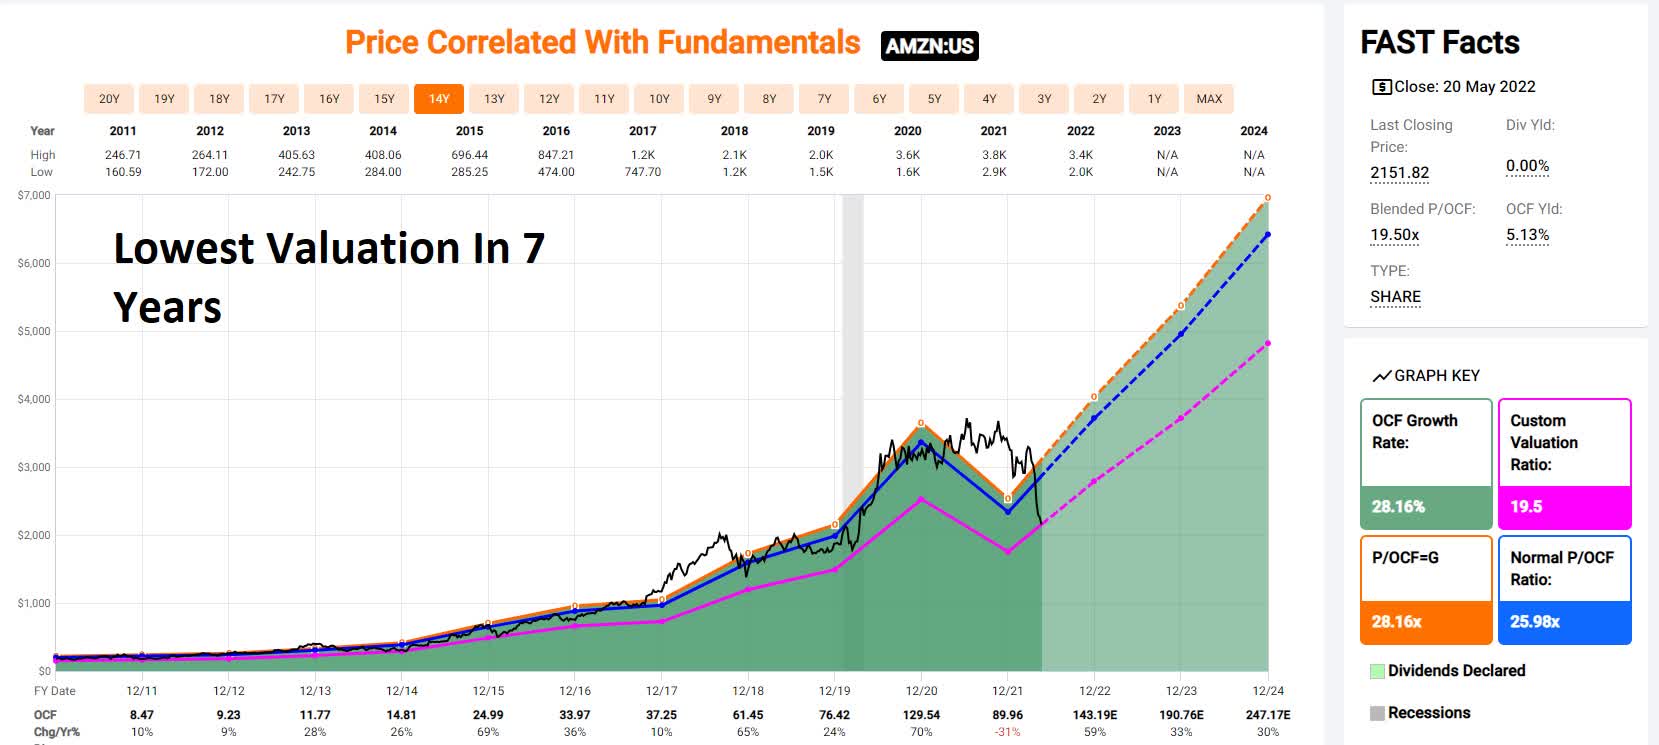
Amazon’s growth thesis remains firmly intact.
| Metric | 2022 Growth Consensus | 2023 Growth Consensus | 2024 Growth Consensus | 2025 Growth Consensus | 2026 Growth Consensus |
2027 Growth Consensus |
| Sales | 13% | 17% | 16% | 11% | 11% | 12% |
| EPS | -76% | 262% | 59% | 34% | 44% | 29% |
| Operating Cash Flow | 44% | 42% | 23% | 24% | 146% | 18% |
| Free Cash Flow | 244% | 191% | 62% | 48% | 29% | 23% |
| EBITDA | 57% | 25% | 33% | NA | NA | NA |
| EBIT (operating income) | -20% | 86% | 68% | NA | NA | NA |
(Source: FAST Graphs, FactSet)
Analysts are likely not yet pricing in a potential recession in 2023 or 2024, but Amazon’s #1 source of cash flow, AWS, is recession-resistant.
- cloud computing savings companies money
- and is recession-resistant
AMZN Rolling Returns Since June 1997
(Source: Portfolio Visualizer Premium)
AMZN’s average growth rate since 1997 was 26%, and through 2027 analysts expect 27%.
- from bear market bottoms returns as strong as 40% annually over the next 15 years
- 148X return over a 15-year
AMZN 2024 Consensus Total Return Potential
(Source: FAST Graphs, FactSet) (Source: FAST Graphs, FactSet)
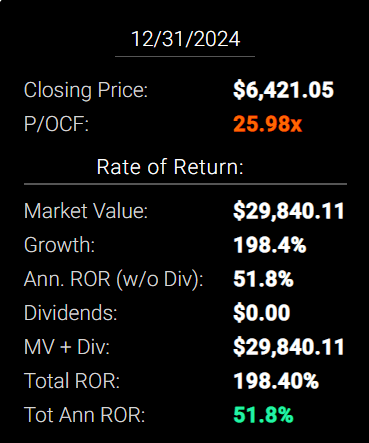
If AMZN grows as analysts expect by 2024 it could deliver almost 200% total returns or 52% annually.
- Buffett-like return potential from a blue-chip bargain hiding in plain sight
AMZN 2027 Consensus Total Return Potential
(Source: FAST Graphs, FactSet) (Source: FAST Graphs, FactSet)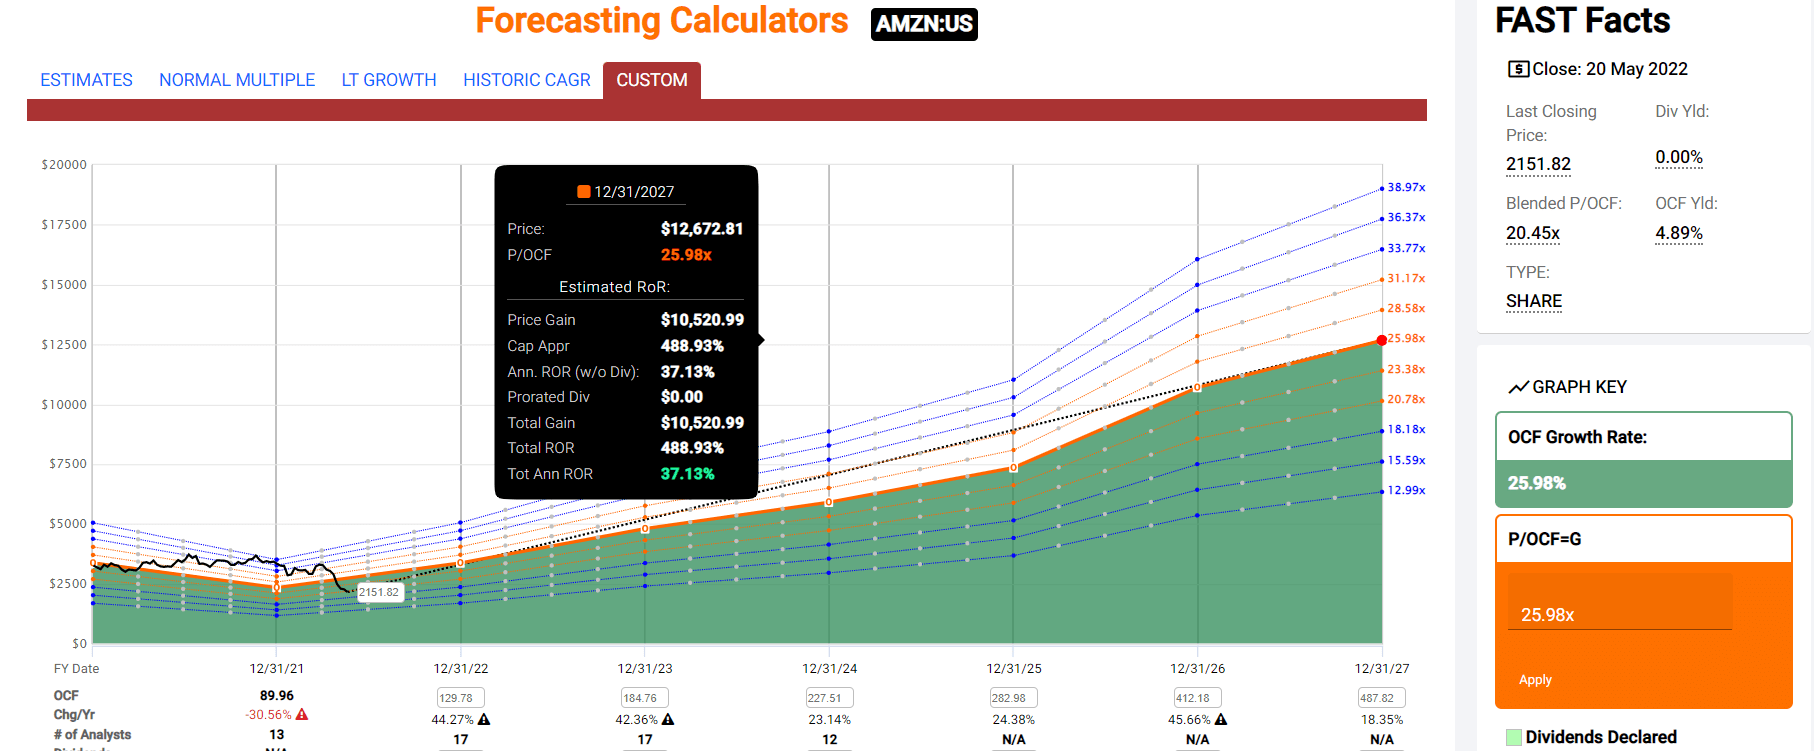
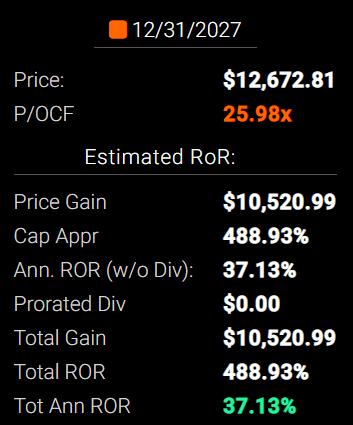
By 2027 if AMZN grows as expected (26% CAGR) and returns to historical fair value, it could deliver almost 500% total returns or 37% annually.
- potential 6X return in 5 years
- 12X the S&P 500
AMZN Long-Term Consensus Total Return Potential
| Investment Strategy | Yield | LT Consensus Growth | LT Consensus Total Return Potential | Long-Term Risk-Adjusted Expected Return | Long-Term Inflation And Risk-Adjusted Expected Returns | Years To Double Your Inflation & Risk-Adjusted Wealth |
10 Year Inflation And Risk-Adjusted Expected Return |
| Adam’s Planned Correction Buys | 4.1% | 19.2% | 23.3% | 16.3% | 13.8% | 5.2 | 3.63 |
| Amazon | 0.0% | 21.7% | 21.7% | 15.2% | 12.6% | 5.7 | 3.29 (Ignoring Valuation) |
| Value | 2.7% | 13.3% | 16.0% | 11.2% | 8.7% | 8.3 | 2.29 |
| High-Yield | 3.1% | 12.7% | 15.8% | 11.1% | 8.5% | 8.5 | 2.26 |
| Nasdaq (Growth) | 1.0% | 13.9% | 14.9% | 10.4% | 7.9% | 9.1 | 2.14 |
| S&P 500 | 1.7% | 8.5% | 10.2% | 7.1% | 4.6% | 15.7 | 1.57 |
| Dividend Aristocrats | 2.2% | 8.9% | 11.1% | 7.8% | 5.2% | 13.8 | 1.66 |
(Sources: Morningstar, FactSet, Ycharts)
- analysts expect AMZN to beat almost all growth investment strategies on Wall Street in the long-term
- including the Nasdaq, aristocrats, and S&P 500
AMZN Total Returns Since June 1997
(Source: Portfolio Visualizer Premium) (Source: Portfolio Visualizer Premium)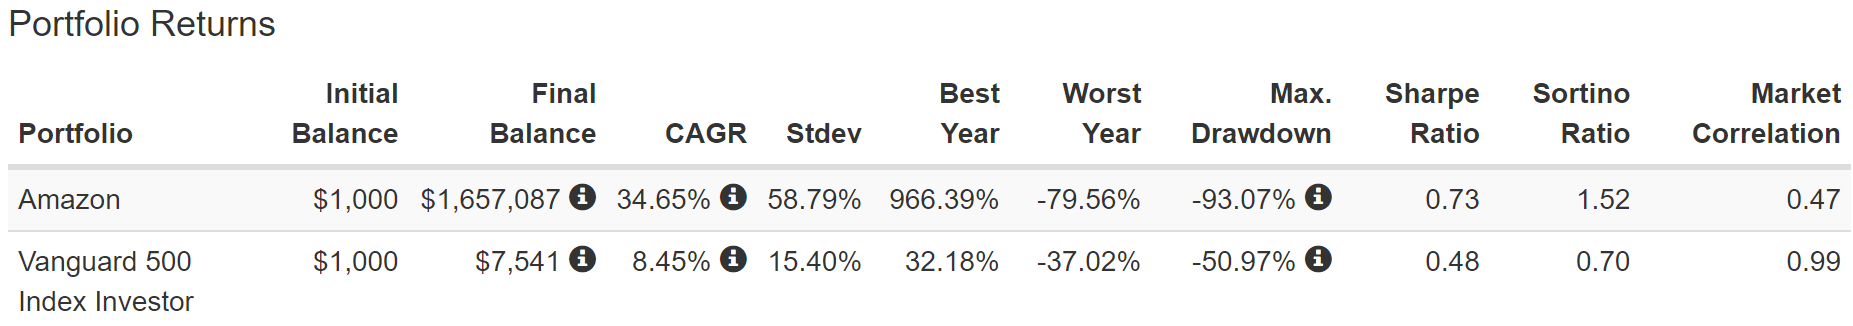
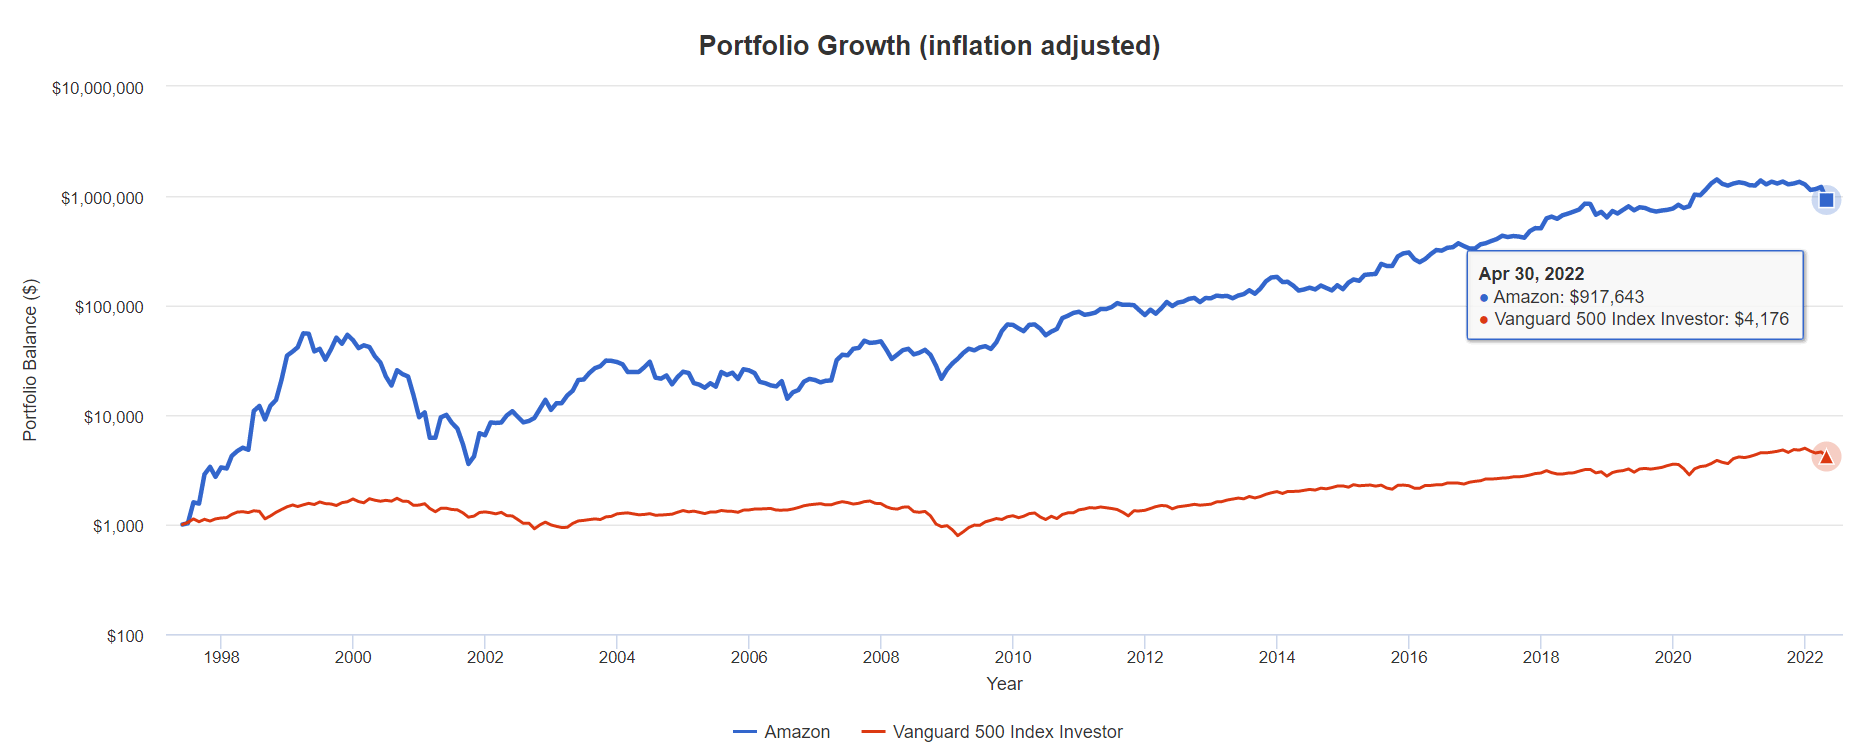
AMZN has delivered 918X inflation-adjusted returns since June 1997, about 230X better than the S&P 500.
What do analysts expect in the future?
Inflation-Adjusted Consensus Return Potential: $1,000 Initial Investment
| Time Frame (Years) | 7.7% CAGR Inflation-Adjusted S&P Consensus | 8.7% PM Inflation-Adjusted Aristocrats Consensus | 19.2% CAGR Inflation-Adjusted AMZN Consensus | Difference Between Inflation Adjusted AMZN and S&P Consensus |
| 5 | $1,445.67 | $1,514.08 | $2,401.43 | $955.76 |
| 10 | $2,089.97 | $2,292.44 | $5,766.87 | $3,676.90 |
| 15 | $3,021.42 | $3,470.93 | $13,848.75 | $10,827.34 |
| 20 | $4,367.98 | $5,255.26 | $33,256.84 | $28,888.86 |
| 25 | $6,314.67 | $7,956.89 | $79,864.02 | $73,549.35 |
| 30 | $9,128.95 | $12,047.36 | $191,787.99 | $182,659.03 |
(Source: DK Research Terminal, FactSet)
Ignoring valuation entirely, if AMZN can only grow as expected for the next 10 years, it could deliver 6X inflation-adjusted returns.
| Time Frame (Years) | Ratio AMZN/Aristocrats | Ratio Inflation-Adjusted AMZN Consensus And S&P Consensus |
| 5 | 1.59 | 1.66 |
| 10 | 2.52 | 2.76 |
| 15 | 3.99 | 4.58 |
| 20 | 6.33 | 7.61 |
| 25 | 10.04 | 12.65 |
| 30 | 15.92 | 21.01 |
(Source: DK Research Terminal, FactSet)
Ignoring valuation entirely, if AMZN grows as expected for a decade it would roughly 3X the S&P 500’s returns.
AMZN Investment Decision Score
DK (Source: DK Automated Investment Decision Tool)

For anyone comfortable with its risk profile, AMZN is as close to a perfect hyper-growth Ultra SWAN investment as exists on Wall Street.
- 45% discount vs 2% market discount = 43% better valuation
- 120% higher long-term return potential than S&P 500 overtime
- about 4x better risk-adjusted expected return over the next five years
Reason Three: World-Class Quality Built To Thrive In Any Economy
There are many ways to measure safety and quality and I factor in pretty much all of them.
The Dividend Kings’ overall quality scores are based on a 253-point model that includes:
-
Dividend safety
-
Balance sheet strength
-
Credit ratings
-
Credit default swap medium-term bankruptcy risk data
-
Short and long-term bankruptcy risk
-
Accounting and corporate fraud risk
-
Profitability and business model
-
Growth consensus estimates
-
Management growth guidance
-
Historical earnings growth rates
-
Historical cash flow growth rates
-
Historical dividend growth rates
-
Historical sales growth rates
-
Cost of capital
-
GF Scores
-
Long-term risk-management scores from MSCI, Morningstar, FactSet, S&P, Reuters’/Refinitiv, and Just Capital
-
Management quality
-
Dividend friendly corporate culture/income dependability
-
Long-term total returns (a Ben Graham sign of quality)
-
Analyst consensus long-term return potential
In fact, it includes over 1,000 fundamental metrics including the 12 rating agencies we use to assess fundamental risk.
-
credit and risk management ratings make up 41% of the DK safety and quality model
-
dividend/balance sheet/risk ratings make up 82% of the DK safety and quality model
How do we know that our safety and quality model works well?
During the two worst recessions in 75 years, our safety model 87% of blue-chip dividend cuts, the ultimate baptism by fire for any dividend safety model.
How does AMZN score on our comprehensive safety and quality models?
AMZN Balance Sheet Safety
| Rating | Dividend Kings Safety Score (162 Point Safety Model) | Approximate Dividend Cut Risk (Average Recession) |
Approximate Dividend Cut Risk In Pandemic Level Recession |
| 1 – unsafe | 0% to 20% | over 4% | 16+% |
| 2- below average | 21% to 40% | over 2% | 8% to 16% |
| 3 – average | 41% to 60% | 2% | 4% to 8% |
| 4 – safe | 61% to 80% | 1% | 2% to 4% |
| 5- very safe | 81% to 100% | 0.5% | 1% to 2% |
| AMZN | 100% | NA | NA |
| Risk Rating | Medium-Risk (52nd industry percentile risk-management consensus) | AA Stable outlook credit rating 0.55% 30-year bankruptcy risk | 20% OR LESS Max Risk Cap Recommendation |
Long-Term Dependability
| Company | DK Long-Term Dependability Score | Interpretation | Points |
| Non-Dependable Companies | 21% or below | Poor Dependability | 1 |
| Low Dependability Companies | 22% to 60% | Below-Average Dependability | 2 |
| S&P 500/Industry Average | 61% (61% to 70% range) | Average Dependability | 3 |
| Above-Average | 71% to 80% | Very Dependable | 4 |
| Very Good | 81% or higher | Exceptional Dependability | 5 |
| AMZN | 94% | Exceptional Dependability | 5 |
Overall Quality
| AMZN | Final Score | Rating |
| Safety | 100% | 5/5 very safe |
| Business Model | 90% | 3/3 wide and stable moat |
| Dependability | 94% | 5/5 exceptional |
| Total | 97% | 13/13 Ultra SWAN |
| Risk Rating |
2/3 Medium Risk |
|
| 20% OR LESS Max Risk Cap Rec |
5% Margin of Safety For A Potentially Good Buy |
Why I Trust Amazon And So Can You
Section 2 of this video showcases the detailed investment thesis for AMZN.
- including why AWS is likely…
Read More: It’s Time To Back Up The Truck On Amazon (NASDAQ:AMZN)


