


Torsten Asmus/iStock via Getty Images
The gold miners’ stocks have been thrashed in recent months, crushed as heavy futures selling slammed gold. That obliterated any residual sector bullishness, leaving gold stocks wildly-oversold and deeply out of favor. But having weathered a rough early summer, the battered miners and their metal are trudging back into their traditional strong season. That begins with robust autumn rallies really accelerating in August.
Seasonality is the tendency for prices to exhibit recurring patterns at certain times during the calendar year. While seasonality doesn’t drive price action, it quantifies annually-repeating behavior driven by sentiment, technicals, and fundamentals. We, humans, are creatures of habit and herd, which naturally colors our trading decisions. The calendar year’s passage affects the timing and intensity of buying and selling.
Gold stocks display strong seasonality because their price action amplifies that of their dominant primary driver, gold. Gold’s seasonality generally isn’t driven by supply fluctuations like grown commodities see, as its mined supply remains relatively-steady year-round. Instead, gold’s major seasonality is demand-driven, with global investment demand varying considerably depending on the time in the calendar year.
This gold seasonality is fueled by well-known income-cycle and cultural drivers of outsized gold demand from around the world. Starting in late summers, Asian farmers begin to reap their harvests. As they figure out how much surplus income was generated from all their hard work during the growing season, they wisely plow some of their savings into gold. Asian harvest is followed by India’s famous wedding season.
Indians believe getting married during their autumn festivals is auspicious, increasing the likelihood of long, successful, happy, and even lucky marriages. And Indian parents outfit their brides with beautiful and intricate 22-karat gold jewelry, which they buy in vast quantities. That’s not only for adornment on their wedding days, but these dowries secure brides’ financial independence within their husbands’ families.
So during its bull-market years, gold has usually tended to enjoy major autumn rallies driven by these sequential episodes of outsized demand. Naturally, the gold stocks follow gold higher, amplifying its gains due to their profits leverage to the gold price. Today gold stocks are once again back at their most-bullish seasonal juncture, the transition between the typically-drifting summer doldrums and big autumn rallies.
Since it is gold’s own demand-driven seasonality that fuels gold stocks’ seasonality, that’s logically the best place to start to understand what’s likely coming. Price action is very different between bull and bear years, and gold remains in a middle-aged bull market. After falling to a 6.1-year secular low in mid-December 2015 as the Fed kicked off its last rate-hike cycle, gold powered 29.9% higher over the next 6.7 months.
Crossing the +20% threshold in March 2016 confirmed a new bull market was underway. Gold corrected after that sharp initial upleg, but normal healthy selling was greatly exacerbated after Trump’s surprise election win. Investors fled gold to chase the taxphoria stock-market surge. Gold’s correction cascaded to serious proportions, hitting -17.3% in mid-December 2016. But that remained shy of a new bear’s -20%.
Gold rebounded sharply from those severe-correction lows, nearly fully recovering by early September 2017. But it failed to break out to new bull-market highs, then and several times after. That left gold’s bull increasingly doubted, until June 2019. Then gold surged to a major decisive breakout confirming its bull remained alive and well! Its total gains grew to 96.2% over 4.6 years by early August 2020, still modest.
Gold’s last mighty bull market ran from April 2001 to August 2011, where it soared 638.2% higher! And while gold consolidated high in 2012, that was technically a bull year too since gold only slid 18.8% at worst from its bull-market peak. Gold didn’t enter formal bear-market territory until April 2013, thanks to the crazy stock-market levitation driven by extreme distortions from the Fed’s QE3 bond monetizations.
So the bull-market years for gold in modern history ran from 2001 to 2012, skipped the intervening bear-market years of 2013 to 2015, then resumed in 2016 to 2022. Thus these are the years most relevant to understanding gold’s typical seasonal performance throughout the calendar year. We’re interested in bull-market seasonality, because gold remains in its latest bull today and bear-market action is quite dissimilar.
Prevailing gold prices varied radically through these modern bull years, running between $257 when gold’s last secular bull was born to August 2020’s latest record high of $2,062. All those long years with that vast range of gold levels have to first be rendered in like-percentage terms in order to make them perfectly-comparable. Only then can they be averaged together to distill out gold’s bull-market seasonality.
That’s accomplished by individually indexing each calendar year’s gold price action to its final close of the preceding year, which is recast at 100. Then all gold price action of the following year is calculated off that common indexed baseline, normalizing all years regardless of price levels. So gold trading at an indexed level of 110 simply means it has rallied 10% from the prior year’s close, while 95 shows it is down 5%.
This chart averages the individually-indexed full-year gold performances in those bull-market years from 2001 to 2012 and 2016 to 2021. 2022 isn’t included yet since it remains a work-in-progress. This bull-market-seasonality methodology reveals that late summers are when gold’s long parade of big seasonal rallies really gets underway. That starts with the major autumn rally which is born in gold’s summer doldrums.
Gold Bull Seasonals Indexed Annually 2001 – 2012, 2016 – 2021 (ZealLLC.com)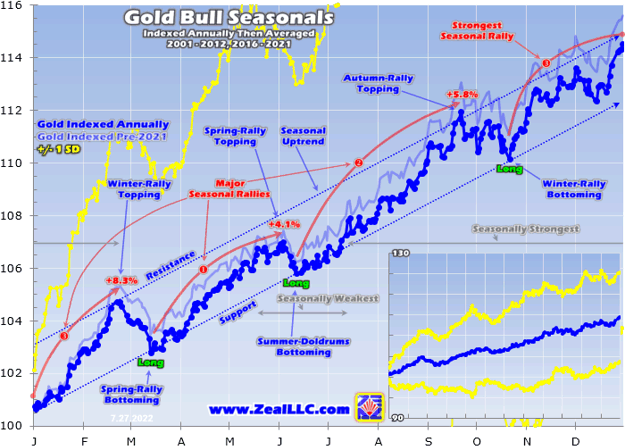
Unfortunately several months ago in mid-April, gold started seriously diverging from seasonal norms. Fed officials panicked over the raging inflation unleashed by their own colossal QE4 money printing. So they embarked on the most-extreme hawkish pivot in this central bank’s entire century-plus history! A violent big-and-fast rate-hike cycle was launched, quickly followed by starting to reverse QE4 through QT2 bond selling.
All that actual and threatened Fed tightening catapulted the US dollar parabolic in an extreme rally. That scared gold-futures speculators into aggressively dumping longs while ramping up shorts. The resulting falling gold prices undermined investors’ bullishness, so they joined in the selling. That culminated in gold plunging 14.3% at worst into mid-July! That left it languishing down 7.3% year-to-date, huge underperformance.
Gold does tend to carve a major seasonal bottom in the summer doldrums, which births its subsequent autumn rally. But seasonally during these modern-bull-market years, that has tended to arrive earlier in mid-June. And gold fared much better on average, up 5.8% YTD at its summer lull. So the yellow metal is seriously behind its seasonal-performance precedent this year due to that super-anomalous US-dollar mania.
But despite gold’s bearish deviation in recent months, seasonals still turn strongly-bullish in late summers. That strength is mostly driven by big marginal demand returning for Asian post-harvest buying followed by that Indian wedding season. On average in these modern gold-bull years from 2001 to 2012 and 2016 to 2021, gold powered 5.8% higher between mid-June to late September! That makes for a strong autumn rally.
Those seasonal gains rank ahead of the spring rally’s 4.1% average but behind the winter rally’s hefty 8.2%. The autumn rally gathers steam as summers mature, with June, July, and August seeing average gains of 0.1%, 1.1%, and 2.0% during these bull years. That makes this seasonal strength well worth chasing. A typical 5.8% autumn rally off of mid-July’s deeply-oversold lows would still carry gold back up near $1,794.
But because it was bludgeoned so low by heavy gold-futures selling, gold’s autumn-rally upside potential this year is far greater than usual. On average in late September, this big seasonal surge has peaked with gold up 11.9% YTD. Merely mean reverting back up to those seasonal norms would necessitate a big 20.8% upleg to $2,047! Outsized autumn-rally gains following excessive selloffs actually aren’t unusual.
That last happened only a couple of years ago in late summer 2020, after gold was sucked into that year’s pandemic-lockdown stock panic. Between its summer-doldrums low in early June to mid-September, gold blasted 16.3% higher! Much of those strong gains were fueled by momentum buying as investors chased gold’s upside. After tumbling into mid-July this summer, gold is sure set up for bigger seasonal gains.
Interestingly the autumn rally’s usual gold demand from Asia should prove outsized this year. After each quarter, the World Gold Council releases excellent Gold Demands Trends reports detailing global gold supply and demand. The latest-available as I write this essay covered Q1’22. Both Chinese and Indian consumer gold demand shrunk sharply in this year’s opening quarter, plunging 18.8% and 18.3% year-over-year!
Beijing’s controversial COVID-Zero policy slammed Chinese gold demand in both Q1 and Q2. The WGC wrote back in late April, “As strict lockdowns were imposed in March across key cities such as Shanghai and Shenzhen, demand all but halted.” Back then the WGC warned, “The usual seasonal Q2 decline is likely to be exaggerated by the negative impact on jewelry demand of continued lockdown restrictions…”
When Chinese consumers are kept in their apartments to slow COVID-19’s spread, they aren’t out buying gold jewelry like usual. Beijing finally started easing its Draconian restrictions through June, but…
Read More: Gold Stocks’ Autumn Rally Coming


