


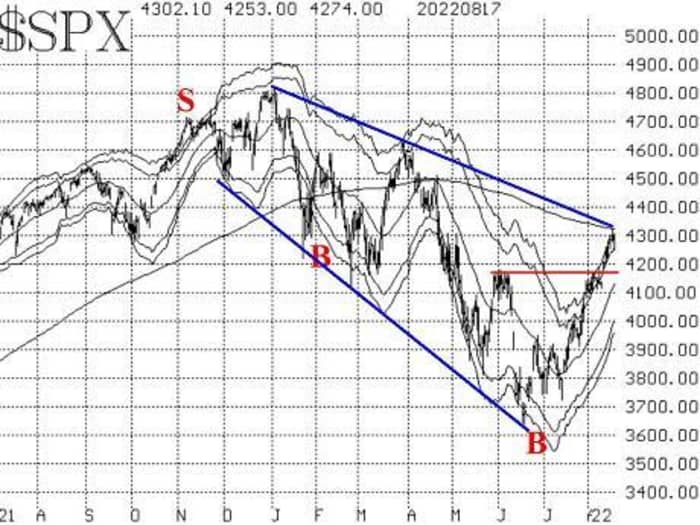
The S&P 500 index has extended its gains, as we expected after last week’s breakout over resistance at 4170.
The target was the declining 200-day moving average, which is currently at about 4325. The S&P
SPX,
did “touch” that 200-day MA this week. Furthermore, the downtrend line that defines this bear market (blue line on the accompanying chart), is also in that same area.
Since there are several overbought conditions currently, SPX may have trouble breaking through that resistance now. A close back below 4170 would be a negative development.
Lawrence McMillan
This past week, SPX closed above the +4σ “modified Bollinger Band” (mBB) again, thus stopping out the “classic” sell signal from last week (we don’t trade those signals) and setting up another one in the near future.
A new “classic” sell signal will occur today if SPX closes below 4274. But a “classic” sell signal needs further confirmation to become a full-fledged McMillan Volatility Band (MVB) sell signal. The previous one never attained that level of confirmation, so we will have to wait to see if the next one does.
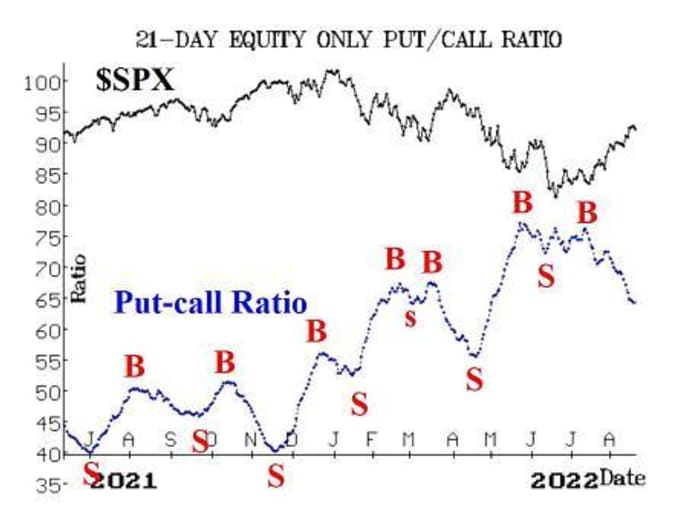
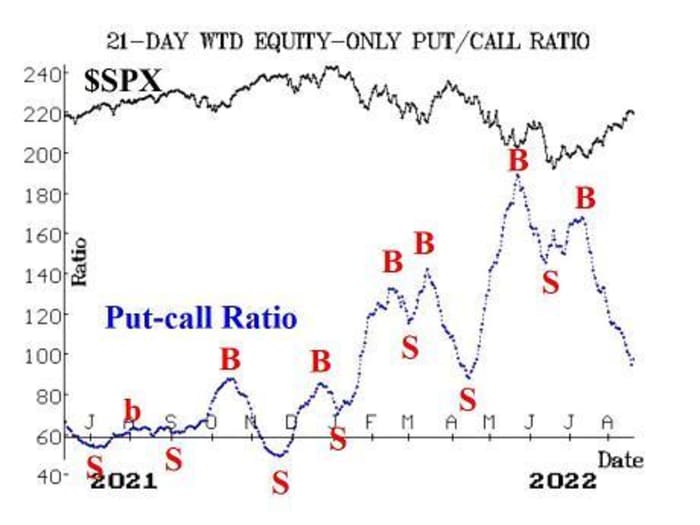
Equity-only put-call ratios continue to remain on buy signals. They have been falling steadily until Wednesday, when they curled up a little. However, the computer analysis programs say that this is nothing to worry about – that the buy signals are intact.
Lawrence McMillan
Lawrence McMillan
Breadth was very strong at the end of last week; the “stocks only” breadth oscillator closed at an all-time high on Aug. 12. The previous all-time high had been set on June 8, 2020, and SPX immediately retreated after that. This time around, there has only been a mild retreat so far. Technically, the breadth oscillators are still on buy signals and can retain that status even with a day or two of negative breadth.
New 52-week highs continue to lag badly. There were only 35 new highs on the NYSE on Wednesday. This indicator remains our only bearish indicator at this time.
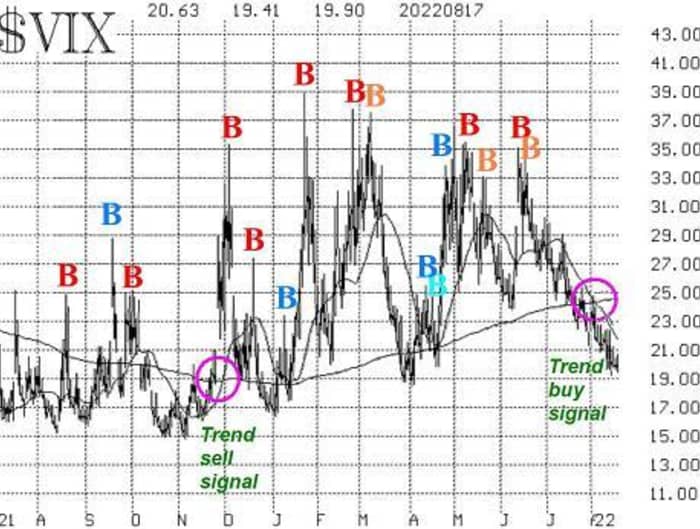
VIX
VIX,
continues to remain below its rising 200-day moving average, and that is an intermediate-term buy signal for the stock market. The buy signal and the previous sell signal (late November 2021) are marked on the accompanying VIX chart. As long as VIX and its 20-day moving average remain below the 200-day moving average, this buy signal will be in effect. V
IX seems reluctant to fall below 19, which is the same level that it held at back in April. That is, there is enough worry among big-money investors, that they are buying SPX puts and thus keeping VIX somewhat inflated. Big money is not always necessarily “smart money,” but it often is.
Lawrence McMillan
The construct of volatility derivatives remains bullish for stocks, as well. The term structure of the VIX futures
VX00,
slopes upward throughout, as does the term structure of the CBOE Volatility Indices.
In summary, almost all of our indicators are bullish, although some are getting overbought. The only major negative is the downtrend line on the SPX chart. As long as that is in place, the bear market is still in existence – perhaps in abeyance, though.
New recommendation: SPX resistance bear spread
SPX has risen up to the 4300+ level, running into resistance in the form of the declining 200-day moving average as well as the downtrend line of the bear market. Therefore we see this as a potential opportunity to establish a bearish spread – preparing to cover it at a loss if SPX breaks on through this resistance:
Buy 1 SPY
SPY,
Oct (21st) at-the-money put
And sell 1 SPY Oct (21st) put with a striking price 30 points lower.
Stop yourself out if $SPX closes above 4400.
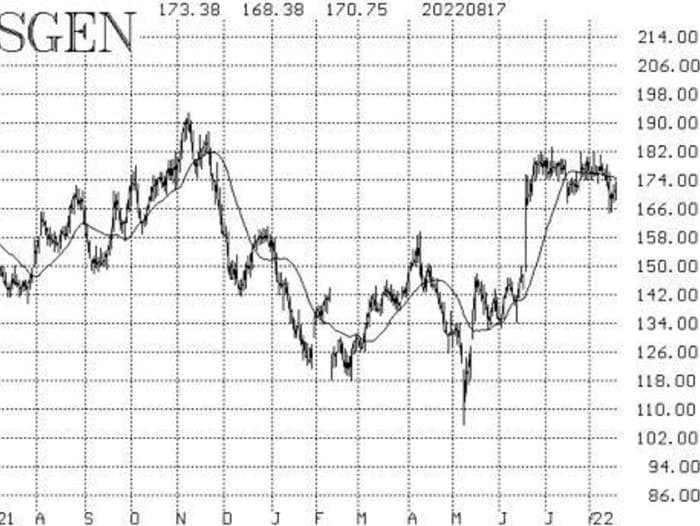
New recommendation: Seagen
Option volume in Seagen
SGEN,
increased significantly recently on speculation that a loss in a recent arbitration case would increase the odds of a potential takeover by Merck
MRK,
in the $200-$225 price range. Stock volume patterns are strong. There is support at 160. Because of the technical conditions here, a call bull spread is worth attempting to buy – at a limit. These options have very wide markets, so be sure to use a limit.
Buy 2 SGEN Sept (16th) 170 calls
and sell 2 SGEN Sept (16th) 185 calls
For a limit of 7.50 per spread.
If bought, we will initially hold these spreads without a stop.
Lawrence McMillan
Follow-up action
All stops are mental closing stops unless otherwise noted.
We are going to implement a “standard” rolling procedure for our SPY spreads: in any vertical bull or bear spread, if the underlying hits the short strike, then roll the entire spread. That would be roll up in the case of a call bull spread, or roll down in the case of a bear put spread. Stay in the same expiration, and keep the distance between the strikes the same unless otherwise instructed.
Long 6 expiring AMLX Aug (19th) 22.5 calls: We are going to exit this position, mainly because the Amylyx Pharmaceuticals
AMLX,
calls have gotten prohibitively expensive (for example, the at-the-money Sept 25 call is offered at 7.20!).
Long 10 expiring CRNT Aug (19th) 2.5 calls: Aviat Networks
AVNW,
has bid a price of essentially $3.08 for Ceragon Networks
CRNT,
but CRNT is not interested in selling. The options’ pricing seems a little off here, but attempt to roll to the Sept (16th) 2.5 calls for a debit of 15 cents (0.15) or less. If that cannot be done, then sell your August calls or let them expire.
Long 2 AAPL Sep (16th) 170 calls: These were rolled up again when Apple
AAPL,
traded at 170. Roll up again – to the Sept (16th) 180 calls – if Apple trades at 180 at any time. We will hold these as long as the put-call ratio buy signal remains in effect.
Long expiring 2 SPY Aug (19th) 426 calls and short 2 SPY Aug (19th) 441 calls: These spreads were bought on July 21st, when several indicators generated buy signals. Then they were rolled up when SPY traded at 411 on July 29 and then rolled up again when SPY traded at 426 on Aug. 12. Sell the current position and roll only half to September. That is, buy 1 SPY Sept (16th) at-the-money call and sell 1 SPY Sept (16th) call with a striking price 13 points higher.
The reason we are exiting one of the spreads is that the “stocks only” breadth oscillator reached all-time-high ground this week and is thus extremely overbought. We will stop ourselves out of this trade if the equity-only put-call ratios roll back to sell signals.
Long 3 MRO Oct (21st) 24 calls: We will hold this position as long as the put-call ratio for Marathon Oil
MRO,
remains on a buy signal.
Long 1 SPY Sept (16th) 414 call and short 1 SPY Sept (16th) 429 call: This position was bought in line with VIX beginning to trend down on Aug. 4. We will hold it as long as VIX does not cross back above its 200-day moving average. Specifically, stop yourself out if VIX closes above 24.60 for two consecutive days.
Long 2 OIH Sept (16th) 230 calls and short 2 OIH Sept (16th) 250 calls: We will hold this position as long as the weighted put-call ratio for the VanEck Oil Services ETF
OIH,
remains on a buy signal.
Long 1 SPY Sept (16th) 423 call and short 1 SPY Sept (16th) 438 call: This position was bought in line with the SPX upside breakout over 4170. Stop this position out on a close below 4160 (note: that is a change in the stop price from what was stated last week).
Long 3 SGFY Sept (16th) 22.5 calls: We are holding without a stop to see if CVS Health
CVS,
does submit a bid for Signify Health
SGFY,
Read More: Now that the S&P 500 is looking overbought, watch what happens to this downtrend line


