


Iurii Garmash
Energy stocks have been the number one sector in the market so far in 2022, and this follows upon its number one performance in 2021. What should we make of that and what does it portend for the future? We should probably start with the fact that energy was the worst performing sector in 2020. There are two ways of looking at this. It would be easy for investors to decide that the 2021-2022 performance by energy stocks is simply part of a huge catchup rally that may now have overshot the mark. Energy stocks had fallen to a point where they were dirt cheap, according to this view, and have since recovered to a point where they are fully priced. The other point of view is that something fundamental has changed in the energy market and the rally starting in the middle of 2020 was just the beginning as the market gradually recognized the implications of that change. Deciding which way to look at the two year monster rally is the key to understanding whether energy is still a good buy right now.
The relationship between energy stocks and highly volatile oil prices is less important than it has been over the past decade. Most oil and gas companies have taken advantage of the high prices over the first half of 2022 to repair their balance sheets and reduce financial leverage. This is true of all the stocks mentioned in this article. All can operate profitably and provide solid future shareholder returns at prices around the average price for 2021 which was about $68 per barrel. This is probably in the low end of the band upon which oil companies base their forward expectations. Prices bouncing around $90 per barrel probably don’t worry energy company CEOs to nearly the degree that short term volatility seems to worry investors and the market. The underlying assumptions for companies mentioned in this article are roughly based on 2021 oil prices and level of volatility.
Energy Sector Performance Over Several Time Frames
On April 20, 2020, the expiring price of WTI futures dropped to negative $37 per barrel so that in theory the futures market was willing to pay you $37 to make a barrel of oil go away. Both long term and short term factors led to that moment of negative oil price. Going into 2020 the dominant long term narrative was that carbon energy was in a secular decline. The major oil companies were pretty much written off as companies in run-off. It wouldn’t have been the first industry to suffer that fate. In the 19th century, 90% of American workers were farmers. Today the number involved in farming has fallen to 1%. That’s what secular decline looks like. We still have farms, of course, but they are vastly larger in scale. Over a period of 100 years this sort of decline is almost certainly the future of carbon energy, but the question for investors is whether that decline is measured in a few years or a few decades. The chances are very good that carbon energy will still be around and produced by businesses operating on the present model for decades.
By early 2020 the mega-cap oil majors were beleaguered on all sides. Green energy activists were making proposals at annual meetings and seeking seats on their boards. Three actually won seats on the board of ExxonMobil (NYSE:XOM) in 2021. The oil majors were easy targets for political leaders because of their longstanding denial of climate change. Unfriendly government policies were on the way. Then in February 2020 the COVID pandemic appeared and effectively shut down the economy. The business of major customers like airlines fell radically so that lower prices were compounded by lower volume. The final straw was the OPEC price war in the first half of 2020.
These factors all contributed to the energy crash in April 2020, but in the longer perspective the most serious challenge to the oil majors was the simple impossibility of replacing their reserves. An energy company which can’t replace the oil it processes and sells eventually goes out of business. On March 29 I wrote about this problem in detail. The short version is that the four largest international oil majors spent $11.5B from 2010 to 2020 versus $6.5 billion from 2000 to 2010 to find roughly the same $40 billion of reserves. All four failed to maintain their level of reserves, and as a group they replaced only 85%. That strongly suggests that the oil majors are in fact in the early stage of the run-off phase. The ten-year chart below compares the Energy Select Sector Spider (XLE) to both the S&P 500 (SPY) and the tech-heavy Invesco QQQ Trust (QQQ). What it shows is the fact that energy fell steadily behind the broader market with technology stocks being the big winner.
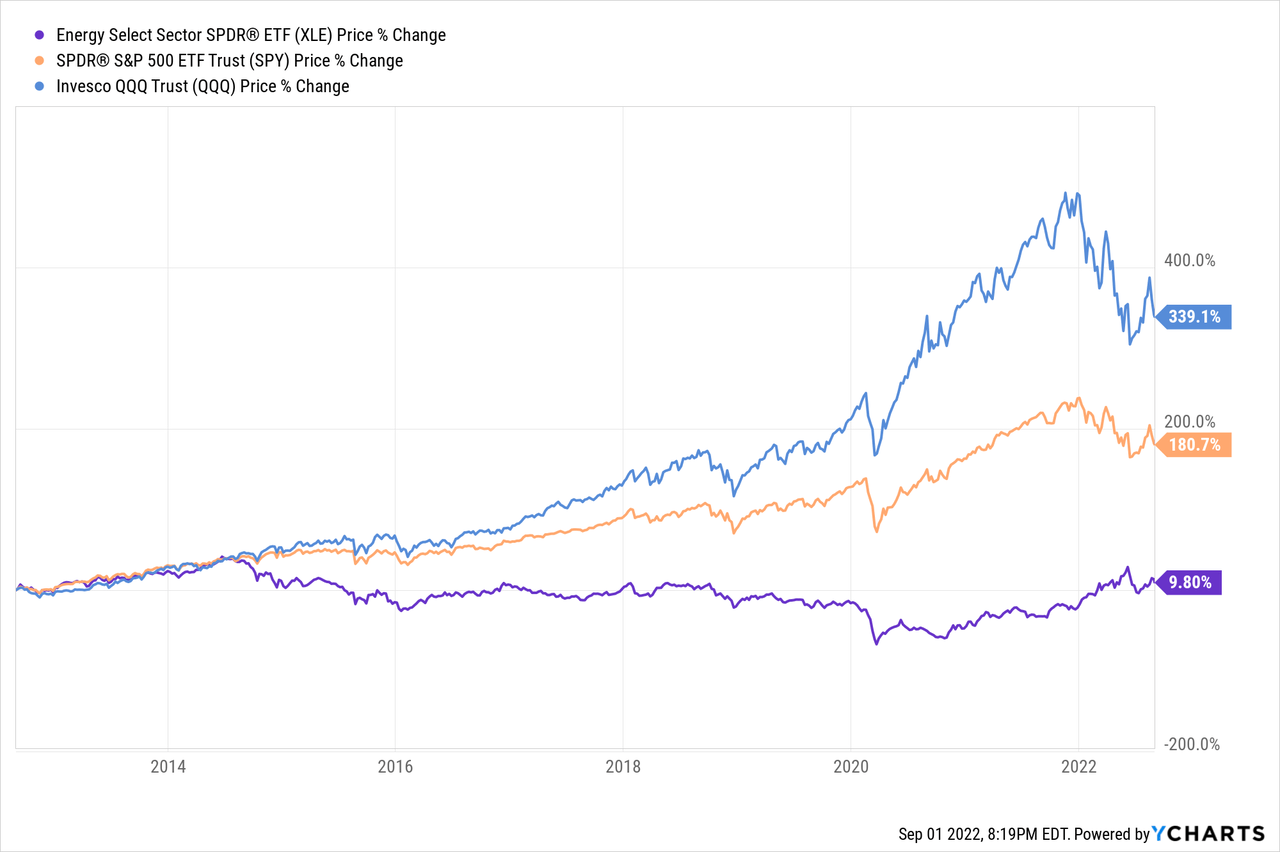
The sharp dip in all three charts shows that by March 2020 most investors had thrown in the towel on energy. I can’t recall any predictions at that time that the energy sector would lead the market over the next two years, but that’s exactly what it did. Does it make any sense that the energy sector has rallied furiously for two years beating technology and all other industries? Looking closely at the chart you can see that after two years of leading the market, energy is still well below its level in 2014 when oil prices were about where they are right now. What does that mean for investors who are considering energy stocks right now? The chart below shows just how powerfully energy stocks rallied over the past year and seized market leadership while the market as a whole, with downside leadership by tech, was sinking.
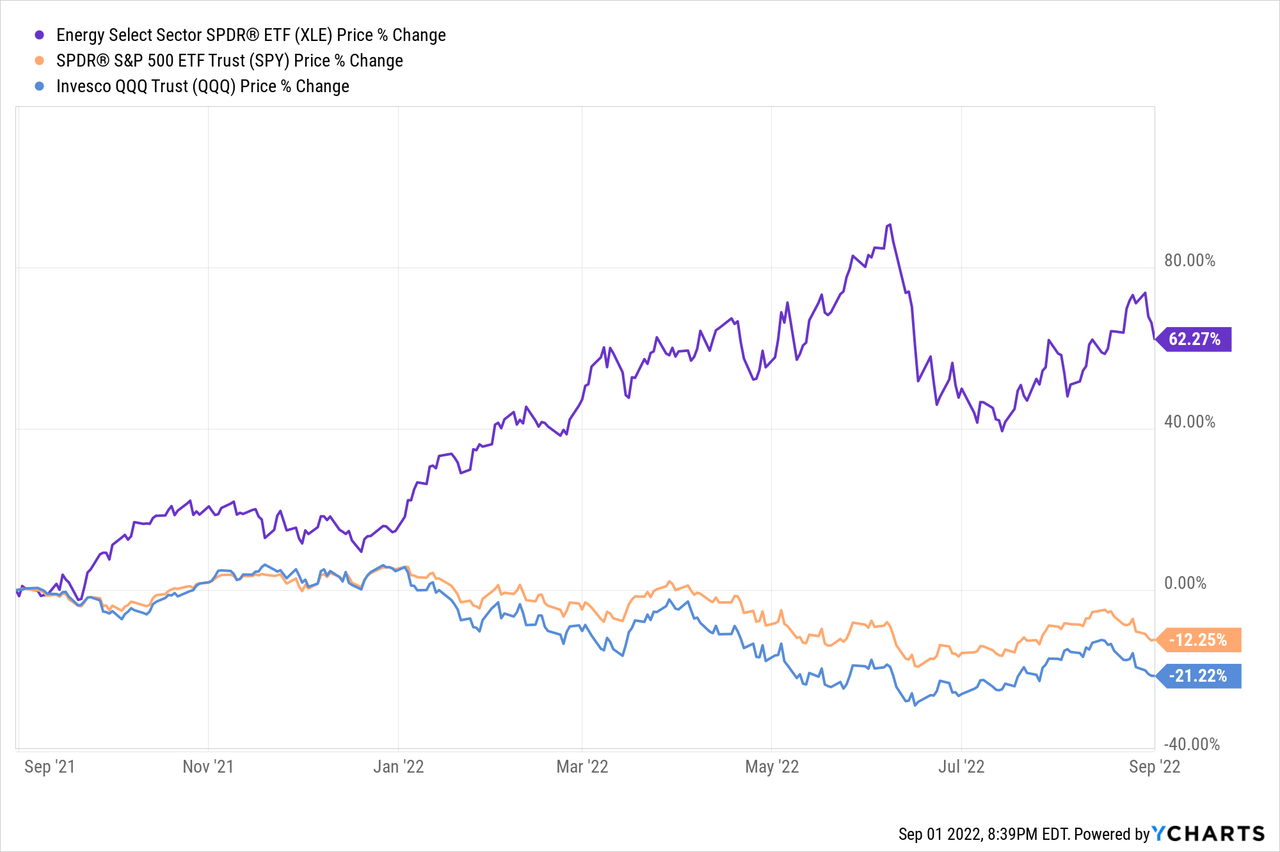
So far in 2022 (as I write this line) the Energy Select Spider ETF (XLE) is up about 40% for the year after having been up as much as much as 60% at its June peak. For 2021 it was up 54%. Since its low point in March 2020 the XLE is up 200%. From its low point in November 2020 the percentage weight of energy in the S&P 500 has more than doubled from just under 2% to just over 4.4%. It’s worth noting that in historical terms this is still a small number as the market is accepting the new energy story with some hesitancy.
The fact that the energy sector bucked the market down trend carries important information. The immediate support for energy outperformance is that the operating results of oil and gas companies have also outperformed. Recent Wall Street projections have the energy sector providing about 10% of S&P 500 earnings in 2022. It’s hitting far over its 4%ish weight. This piece by Factset notes that while S&P 500 earnings were up 6.7% for the first half of 2022 they would have been negative 3.7% without energy.
At the very least the narrative predicting the immediate demise of carbon energy has been shown to be exaggerated. In his 2020 Shareholder Letter, Warren Buffett, a strong supporter of going green rationally, pointed out the difficulties in delivering renewable sources to the large cities which are the major users of energy. Buffett should know, having taken no dividends from Berkshire Hathaway’s (BRK.A)(BRK.B) BHE unit while it devotes all of its earnings to constructing the necessary grid for renewables. Buffett’s target date for completing this project is 2030 and BHE has a substantial head start when compared with other utilities. The inescapable implication is that while the use of carbon energy will decline in the very long run, the decline will be gradual. Nothing could have put this in focus more clearly than the supply squeeze stemming from the Russian invasion of Ukraine.
The premise of this article is that oil and gas will continue to be the major source of energy for quite a while – long enough for current energy investors to do extremely well. The narrative of carbon energy’s secular decline got a couple of decades ahead of itself. The major opportunity lies in the fact that even after a powerful rally the positives in the energy narrative seem not to be fully factored into energy stock prices. Bucking the trend in what increasingly looks like a bear market is a powerful hint that the energy stocks may continue to be leaders in the next bull market.
Is Now The Time To Buy Energy Stocks?
One of two key questions is how to weigh the several time frames at work with oil and gas and the energy sector. In the longest time frame the energy sector has fallen from a bloated 28% in 1980, when it had been the leader for the long 1970s commodity inflation cycle. That 28% was a clear overshoot, and those who thought that energy stocks only went up were in for a big disappointment. Starting in 1980 most parts of the market did better. In 2000 the weight of energy rallied back to 15% and it tagged that 15% level again in 2010. Since then, while tech led the market, energy stalled and then fell below 2% in November 2020. It is around twice that today. In the long run energy will lose ground to technological innovation, but for the moment it appears to be tech which is overextended while energy makes a comeback.
The important question for investors is whether the 2020 reversal should be viewed as a major turning point. Are we about to see a series of long term highs in energy prices or do current energy prices merely reflect a number of short term factors? The very difficulty of replacing reserves and the relatively modest recent capital expenditures for exploration and production suggest that such a long term turning point was due. The target is not the 28% S&P weighting of 1980 but it might approach the 15% of 2000 and 2010.
What this means is that in the longer perspective, energy stocks are probably cheap. That being said, it’s usually wise to be prudent when the price of an asset has recently tripled as the Energy Select Sector ETF has done since April 2020. The present market may be in the process of providing a dip-buying opportunity as energy has succumbed to the general market slide for the past few days. Investors might watch for an opportunity to buy in the course of the present market correction.


