


The Market
It feels like we’re in the dripping phase now, doesn’t it? Each day we have a rally
attempt and each day the market ends at or near the lows of the day. We have even
discussed how you can’t chase stocks on the upside, despite good charts, because they just
don’t seem to work.
But after six-straight days of this type of action, is the pattern too obvious?
We are oversold once again, on a short- and an intermediate-term basis. Tomorrow’s
consumer price index will likely move the bond market, but that hasn’t budged in two days
–- meaning it hasn’t gone down more (rates are a smidge lower).
Despite the lower-lows in the major indexes, the number of stocks making new lows, while
high, have yet to increase over the number of new lows we saw in late September. If new
lows on Nasdaq surge over 1,300 we’ll have more than we had in late September, but still
fewer than we had in May.
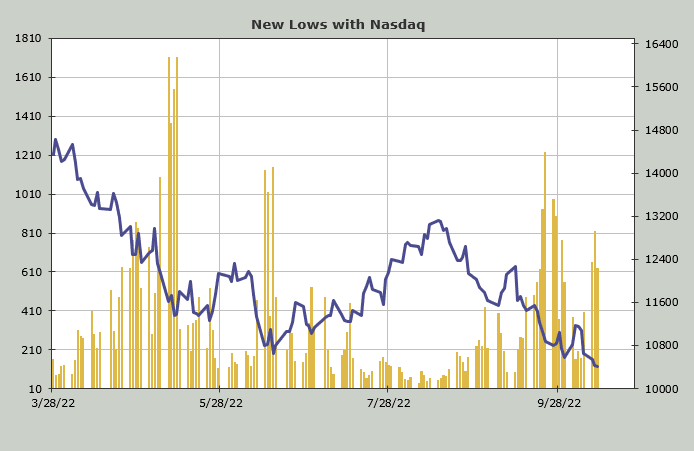
Even today, despite the late day selloff, there was more upside volume than downside
volume on Nasdaq.
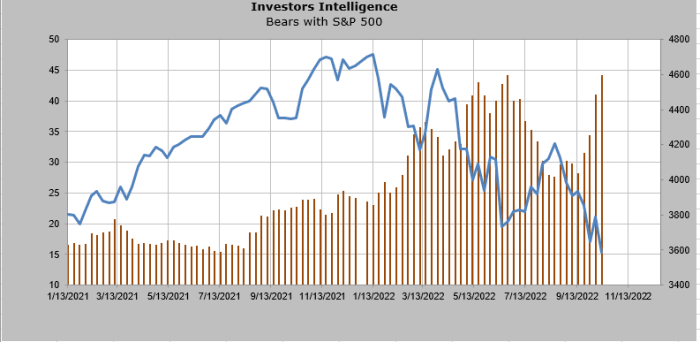
The Investors Intelligence bulls are now at 25%, which is essentially no change
from last week. The bears are now at 44%, the same place they were in June. If you want to
compare these to 2008, the bears got to 54% in October 2008. That’s right, October was the
peak reading for bears. By March 2009 (the low) bears were down to 47%.
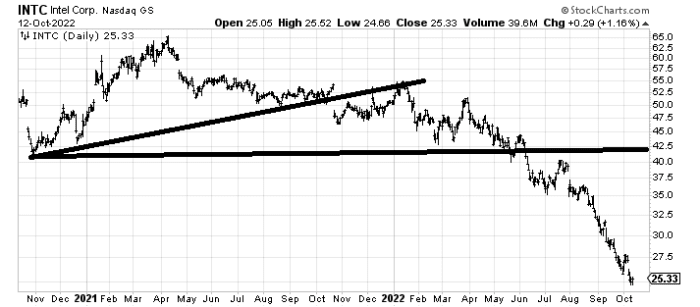
The biggest negatives remain; the charts are terrible for the most part. The
semiconductors stink, but at least, unlike a few months ago, folks now have a laundry list
of why we shouldn’t like the semis. You might recall we looked at Intel (INTC:Nasdaq)
months ago, when it was breaking down, and I said there was a measured target in the low
$20 area. Well, we are awfully close to that area. If you stretched a rubber band too far
it would break. This decline since August is starting to look like a rubber band that has
been stretched too far.
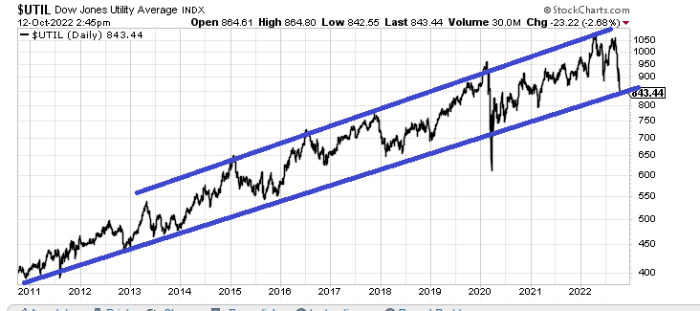
The other negative we need to discuss is the utility sector. The utes have been a horror
show. I still think we’re a bit early to like them, but if that doesn’t look like forced
selling, I don’t know what does. My guess is there is a bounce and another push down. I’d
probably like the Utes more on that second push down (I said the other day I think we’re a
few weeks away from warming up to them and still believe that to be the case). But they
need a bounce.
It’s possible the market will simply keep going down every day, but I think bear markets
need rallies and this one needs a rally.
New Ideas
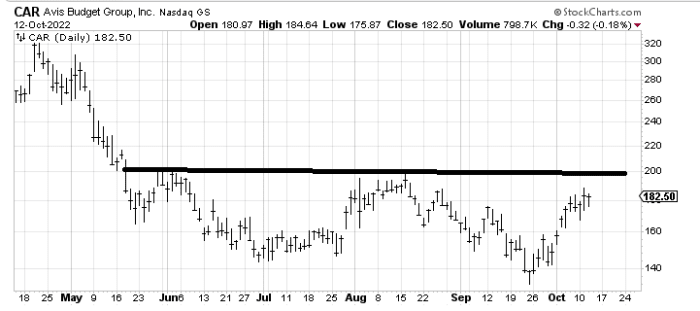
The transports have been green for three-straight days. Avis (CAR:Nasdaq) looks to me like
it can make a try for resistance at $200.
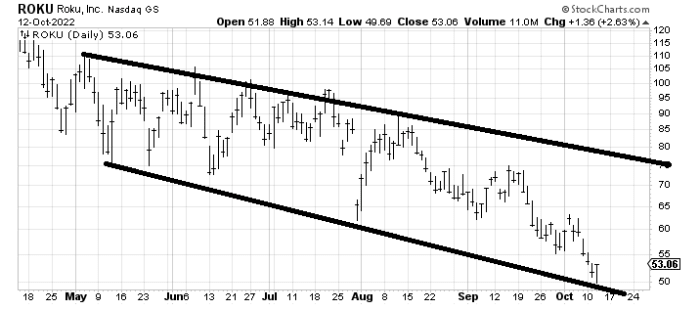
Months ago I was asked about Roku (ROKU:Nasdaq) and I drew in this channel line, which the
stock had been tracking most of this year. I also measured a target near $50 and said if
ROKU hits $50 at the same time it tags that lower line I think it’s good for a bounce. It
has done so and was actually up today. It’s a stock in a downtrend but worth a trade I
think.
Today’s Indicator
The Volume Indicator is oversold.
Q&A/Reader’s Feedback
Helene welcomes your questions about Top Stocks and her charting strategy and
techniques. Please send an email directly to Helene with your questions. However, please
remember that TheStreet.com Top Stocks is not intended to provide personalized investment
advice. Email Helene here.
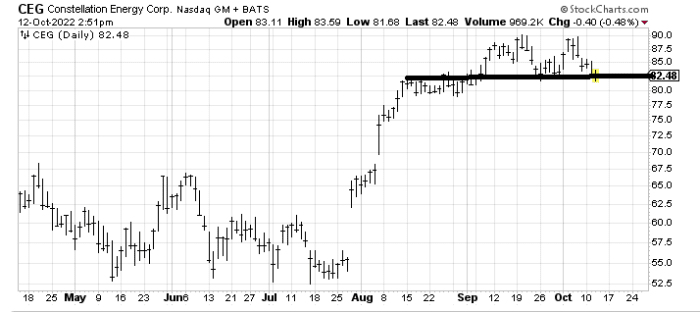
The question is if Constellation Energy (CEG:Nasdaq) is forming a top. I can tell you
this: It has the look and feel of First Solar that we looked at the other day. That means,
yes, it feels like a top — but unless there is a lower low (under around $80) it isn’t. A
failing rally to, say $85, that then turns down would be a warning.
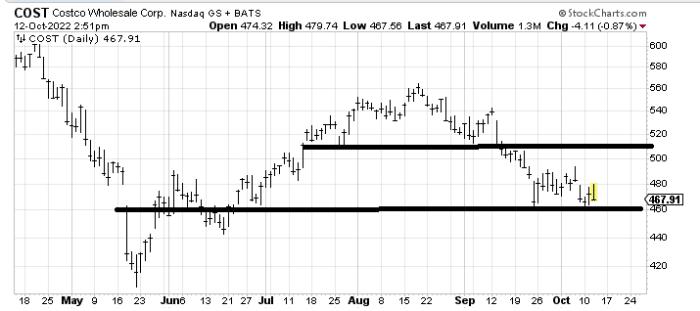
Costco (COST:Nasdaq) has hit its downside target from that small top it had broken down
from. Now it needs to prove it can hold $460. If it cracks under $460 the support near
$440
should provide a first bounce area.
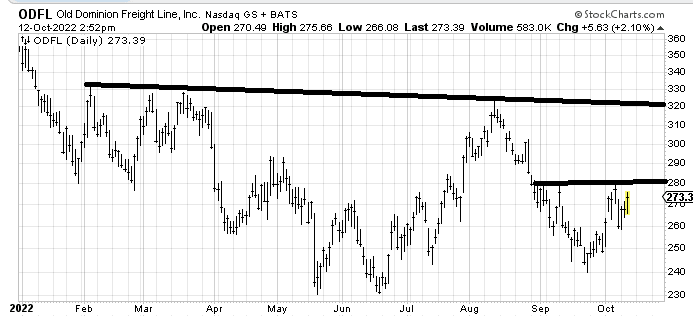
I have no idea why the truckers aren’t being sold, and, in fact, are up. Perhaps it is the
risk of a rail strike coming (we looked at UNP last week and I was not a fan). If Old
Dominion (ODFL:Nasdaq) can get over $280, there is still plenty of resistance all the way
up (starting at $290) but that would be a positive.
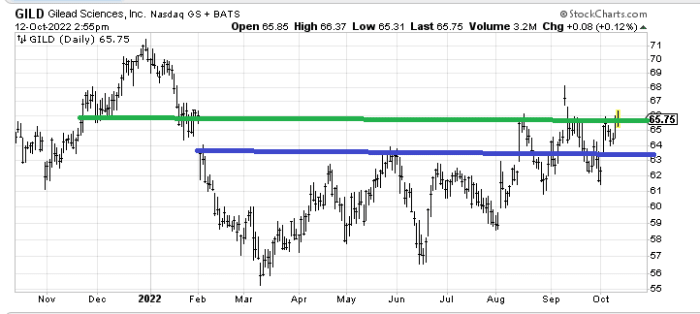
Gilead (GILD:Nasdaq) is one of those charts that always sucks me in and then spits me out.
Just look at the breakout over the blue line back in August that then gave it all back.
Then the breakout over the green line in September that then gave it all back. If it makes
another run up into that $67-$68 area I’d be a seller.
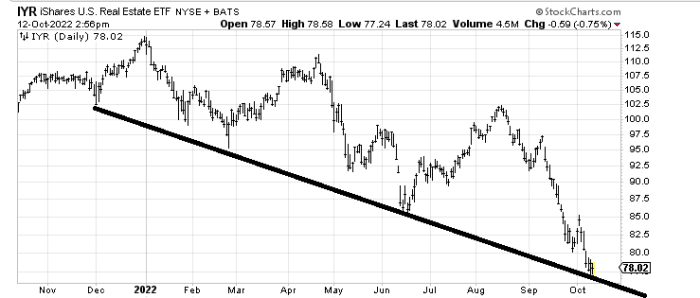
The iShares U.S. Real Estate ETF (IYR) – Get iShares U.S. Real Estate ETF Report looks awful. But it is at a line that it has
been bouncing off for the last year. So I would expect a bounce from here.
Read More: Bear Markets Need Rallies, Too


