


The Market
Well today was fascinating because all the upside action seemed to be in names that are
likely up due to short-covering.
Here’s the best example I can give you. On Monday, stocks such as what we used to call
(maybe we still do!) “the ARKK names” sat it out. Today those names were up and leading.
Aside from the usual software stocks there was Coinbase (COIN:Nasdaq), Lyft
(LYFT:Nasdaq) and Beyond Meat (BYND:Nasdaq). Most of them had huge moves that just
felt more like shorts covering.
That having been said, breadth was terrific. But along with the terrific breadth comes
some short-term overbought readings. Last night I noted my Oscillator would be overbought
by the end of this week and now you can see how that will be the case.
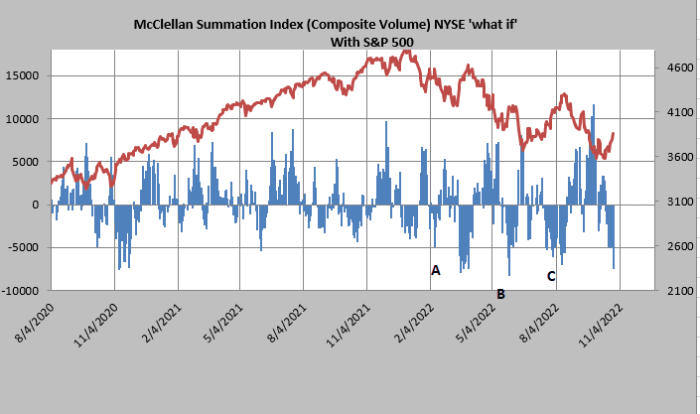
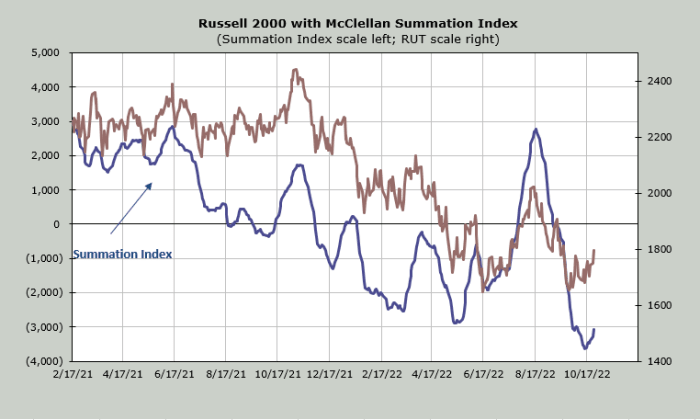
The McClellan Summation Index is moving up enough that you can actually see it on the
chart now (shown below). This is a plus for the market. However, when I do a calculation
for what it will take to turn this indicator back down (using volume instead of breadth)
you can see that once this dips under -5,000 (which is a net negative 5 billion shares –
that’s up minus down) we’re overbought short term.
If you go back to 2020 it was very short term — just little dips. If we use 2022, then
the
March move (A) came around March 18 so we still had another week or so of rallying. In
late May (B) that was pretty much it. In late July/early August we managed another week
before the market rolled over.
I think a pullback would be helpful for us to see what stocks are holding and what stocks
are not. I still believe after a pullback we should rally again.
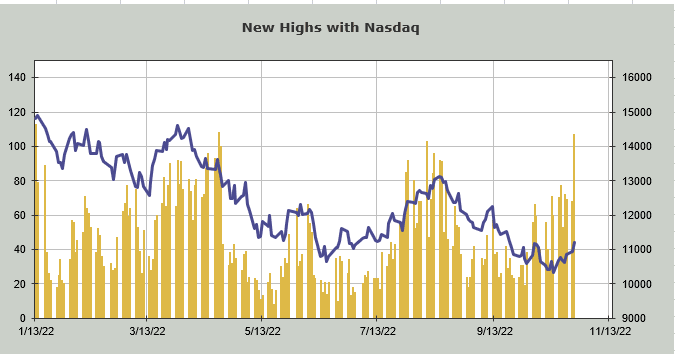
Let me also note that the number of stocks making new highs on the NYSE barely increased
today yet the number of new highs for the Nasdaq had a large increase, enough to get it up
to March levels. Usually for the market to peak and roll over we need to see new highs
tail off while the index moves higher and the Summation Index rolls over. That’s why it
feels too soon for that.
I would note that the S&P 500 is now at its 50-day moving average. So is the Russell 2000
(which is also at the important resistance of 1800. And heck the SOX (Philadelphia
Semiconductor Index) has been green for seven straight days.
The biggest challenge I see is that sentiment has turned rather quickly. Perhaps the poor
after-
hours reaction to earnings from Microsoft (MSFT:Nasdaq) and Alphabet
(GOOGL: Nasdaq) will change that. But too many embracing the rally is not what we want to
see.
New Ideas
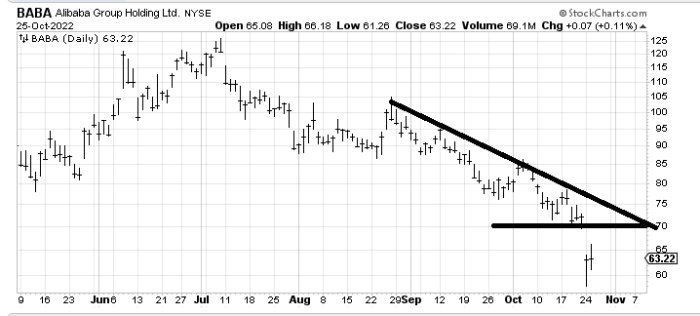
With the news out of China this week, or perceived news, I have been asked about buying
stocks such as Alibaba (BABA) – Get Alibaba Group Holding Limited American Depositary Shares each representing eight Report because they have fallen so far and hard. If we
have learned nothing from the market in 2022 it is that catching a falling knife is
dangerous to your portfolio. I would put BABA in that category. If it rallies to $70-ish
I’d be a seller.
Today’s Indicator
The McClellan Summation Index is rising. It now requires a net differential of -4,000
advancers minus decliners on the NYSE to halt the rise, which makes it a little bit
overbought.
Q&A/Reader’s Feedback
Helene welcomes your questions about Top Stocks and her charting strategy and
techniques. Please send an email directly to Helene with your questions. However, please
remember that TheStreet.com Top Stocks is not intended to provide personalized investment
advice. Email Helene here.
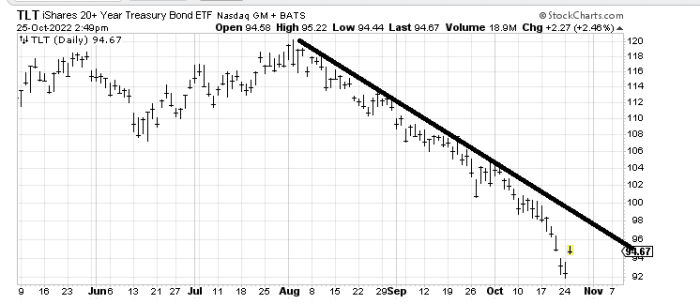
The question is where to sell iShares 20+ Year Treasury Bond ETF (TLT:Nasdaq), or
where can it rally to? The answer is that TLT needs to string together at least two
consecutive up days for me to believe it can make it to the downtrend line (currently $98-
ish). If TLT can stay over $94 — a big if — then it would have left an island down
below. It’s all still very tentative.
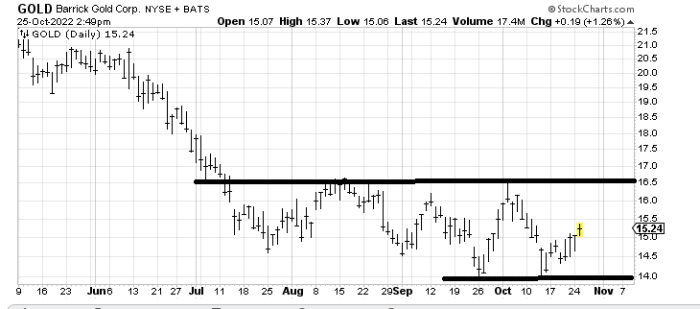
Barrick Gold (GOLD) – Get Barrick Gold Corporation (BC) Report is a chart in a trading range with a lot of resistance at
$16-16.50.
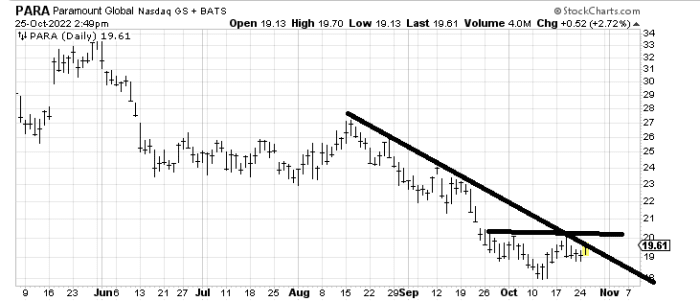
Two weeks ago we looked at Charter Communications (CHTR:Nasdaq) and Comcast
(CMCSA:Nasdaq), both with a more positive eye. Now we have Paramount Global
(PARA:Nasdaq) and it is trying to form a head-and-shoulders bottom. A tiny one. Very tiny.
If PARA crosses $20 it measures to $22 where resistance starts and gets quite heavy at
$23.
Read More: A Different Kind of Rally


