


Aslan Alphan
The gold miners’ stocks have been battered over this past half-year, bludgeoned relentlessly lower with gold. Heavy gold-futures selling fueled by the US dollar shooting parabolic in a mania has slammed the yellow metal. Gold’s normal seasonal trends have been overpowered by speculators’ leveraged gold-futures dumping. But with their selling capital firepower exhausted, gold’s usual winter rally should roar back.
Seasonality is the tendency for prices to exhibit recurring patterns at certain times during the calendar year. While seasonality doesn’t drive price action, it quantifies annually-repeating behaviors driven by sentiment, technicals, and fundamentals. We humans are creatures of habit and herd, which naturally colors our trading decisions. The calendar year’s passage affects the timing and intensity of buying and selling.
Gold stocks display strong seasonality because their price action amplifies that of their dominant primary driver, gold. Gold’s seasonality generally isn’t driven by supply fluctuations like grown commodities see, as its mined supply remains relatively steady year-round. Instead gold’s major seasonality is demand-driven, with global investment demand varying considerably depending on the time in the calendar year.
This gold seasonality is fueled by well-known income-cycle and cultural drivers of outsized gold demand from around the world. And the biggest seasonal surge of all is just getting underway heading into winter. As the Indian-wedding-season gold-jewelry buying that normally drives this metal’s big autumn rally winds down, the Western holiday season ramps up. The holiday spirit puts everyone in the mood to spend money.
Men splurge on vast amounts of gold jewelry for Christmas gifts for their wives, girlfriends, daughters, and mothers. The holidays are also a major engagement season, with Christmas Eve and New Year’s Eve being two of the biggest proposal nights of the year. Between a third to half of the entire annual sales of jewelry retailers come in November and December! And jewelry historically dominates overall gold demand.
The World Gold Council closely tracks global gold supply and demand, publishing the latest data each quarter. During the last five calendar years, jewelry demand averaged 49.1% of overall total world gold demand. That is much larger than investment demand, which averaged 31.9% during that same 2017-to-2021 span. Year to date in 2022 as of the end of Q2, jewelry demand is tracking at a similar 45.7% of total.
The usual frenzied Western jewelry buying heading into Christmas shifts to pure investment demand after year-end. That’s when Western investors figure out how much surplus income they earned during the prior year after bonuses and taxes. Some of this is plowed into gold in January, driving it higher. Finally the big gold winter rally climaxes in late February on major Chinese New Year gold buying flaring up in Asia.
So during its bull-market years, gold has always tended to enjoy powerful winter rallies driven by these sequential episodes of outsized demand. Naturally the gold stocks follow gold higher, amplifying its gains due to their great profits leverage to the gold price. Today gold stocks are now once again heading into gold’s strongest seasonal rally of the year, driven by this annually-recurring robust winter gold demand.
Since it is gold’s own demand-driven seasonality that fuels gold stocks’ seasonality, that’s logically the best place to start to understand what normally happens in coming months. This latest gold-winter-rally analysis is complicated by recent technical events. Between early March’s anomalous geopolitical-spike high on Russia invading Ukraine to late September, heavy gold-futures selling pummeled gold 20.9% lower.
So the yellow metal was just slammed into bear-market territory, technically making 2022 a bear year! Gold’s price action in bull years and bear years is quite different, and it’s bull-market seasonality we’re interested in. That certainly calls into question whether this old research thread is applicable this winter. But because of what drove gold’s recent 20%+ plunge, odds are it is an oversized correction in a secular bull.
Gold’s geopolitical spike to $2,051 lasted a single trading day, leaving gold unsustainably overbought as I warned at the time. Without that short-lived peak, gold’s total selloff over the next 6.6 months would have been 18.8%. That’s a large major correction, but not a new bear. And the dominant driver of the recent big selling was speculators’ heavy-to-extreme gold-futures dumping, which is anomalous and self-limiting.
These hyper-leveraged traders’ capital firepower available for selling is very finite. And that sure looks exhausted based on historical precedent. They’ve liquidated about as many long contracts as they are likely able to, recently crushing total spec longs to a deep 3.4-year low! And they’ve pretty much hit their probable limit on short selling too, with total spec shorts soaring to a stunning 3.8-year high in late September!
Such spec-gold-futures bearish-positioning extremes never last long, soon giving way to massive mean-reversion buying that catapults gold sharply higher. After the last similar episode in May 2019, gold rocketed up 21.5% in just 3.3 months! This inevitable coming big gold-futures buying will be accelerated by the wildly-overcrowded long-US-dollar trade rolling over. So gold’s recent lows aren’t likely to last very long.
Technically gold’s next bull-market upleg could already be underway, and will likely be confirmed during this year’s winter-rally span. Specs’ mandatory gold-futures short-covering buying quickly pushes gold high enough to attract back other long-side speculators. Their larger buying soon drives enough upside momentum to entice investors to chase gold with their vastly bigger pools of capital, supercharging its gains.
So with gold barely in bear territory measured from an artificial high, and the recent selloff mostly fueled by heavy-to-extreme gold-futures selling that has to soon reverse, we ought to give gold the benefit of the doubt seasonally. 2022 might yet end up being a gold-bull year, and it certainly isn’t a normal gold-bear one! The gold-bull years for seasonal analysis in modern history ran from 2001 to 2012 and 2016 to 2021.
Gold’s earlier mighty bull market ran from April 2001 to August 2011, where it soared 638.2% higher! And while gold consolidated high in 2012, that was technically a bull year too since gold only slid 18.8% at worst from its bull-market peak. Gold didn’t enter formal bear-market territory until April 2013, thanks to the crazy stock-market levitation driven by extreme distortions from the Fed’s QE3 bond monetizations.
That bear ultimately mauled gold to a 6.1-year secular low in mid-December 2015, which birthed another bull. Over the next 4.6 years into early August 2020, gold gradually powered 96.2% higher to $2,062. That latest young-and-small secular bull was technically just staked by this summer’s anomalous extreme gold-futures selling. Again huge mean-reversion buying will likely leave this new baby bear short-lived.
So the bull-market years for gold in modern history ran from 2001 to 2012, skipped the intervening bear-market years of 2013 to 2015, then resumed in 2016 to early 2022. These are the years most relevant to understanding gold’s typical seasonal performance throughout the calendar year, including its powerful winter rallies. The exceedingly-bearish gold-futures specs normalizing their lopsided bets would amplify that.
Prevailing gold prices varied greatly through these modern bull years, running from way down at $257 in April 2001 to that latest $2,062 record high in August 2020. To render that enormous range of gold prices spanning two secular bulls perfectly comparable, they must first be converted into like-percentage terms. Only then can these long years of gold prices be averaged together to distill out gold’s bull-market seasonality.
That’s accomplished by individually indexing each calendar year’s gold price action to its final close of the preceding year, which is recast at 100. Then all gold price action of the following year is calculated off that common indexed baseline, normalizing all years regardless of price levels. So gold trading at an indexed level of 110 simply means it has rallied 10% from the prior year’s close, while 95 shows it is down 5%.
This chart averages the individually-indexed full-year gold performances in those bull-market years from 2001 to 2012 and 2016 to 2021. With its bull-bear status uncertain, 2022 isn’t included yet. This bull-market-seasonality methodology reveals that gold’s strongest seasonal rally by far is its winter one which tends to start in late October! That portends big gains in coming months from selloff-depressed gold stocks.
Gold Bull Seasonals 2001 – 2012, 2016 – 2021 (ZealLLC.com)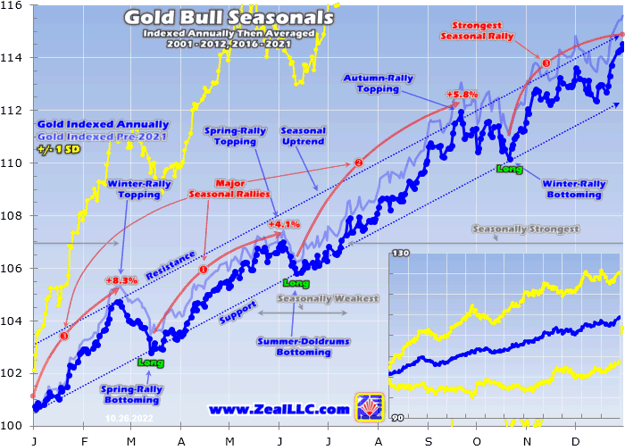
Gold’s average performances during these modern bull years have proven impressive, clocking in with 14.5% gains. And those were dragged lower by a poor 2021, where gold slumped 3.6%. Essentially the same dynamics that have plagued gold this year also dogged it last year. Extreme Fed hawkishness ignited big US-dollar surges, which goaded the hyper-leveraged gold-futures speculators into heavy selling.
Gold actually got off to a strong start in 2022, up 8.1% YTD in mid-April even after that earlier geopolitical spike had faded. That was way ahead of the +4.7% seasonal average at that point. But as Fed officials panicked about the raging inflation unleashed by their own extreme money printing, the wheels started falling off gold. The Fed embarked on its most-extreme hawkish pivot ever, catapulting the US dollar parabolic.
That prematurely truncated gold’s spring rally, obliterated its usually-stronger autumn rally, and forced the yellow…
Read More: Gold Stocks’ Winter Rally 7


