


The Market
We had one big up day for the indexes on Friday and everyone is a bit confused, because I
said the market is overbought. It is short-term overbought. It is not intermediate-term
overbought. It also has been red for three of the last four trading days.
In reality, last Friday’s rally had statistics that were nothing to write home about.
Breadth was good, but not nearly as good as earlier in the week. Last Tuesday the S&P
tacked on 61 points and net breadth was positive 2,210. On Friday, the S&P was up 93
points and net breadth was positive 1,660.
This does not make the market negative. It makes it overbought. For the short term. Should
we manage to get a pullback — remember, we’re at three of four days red already — we can
work that overbought reading off. Here is the Overbought/Oversold Oscillator for
reference.
Then we have a day like today, which is more similar to last week’s down days. The indexes
are down, but breadth is mostly flat.
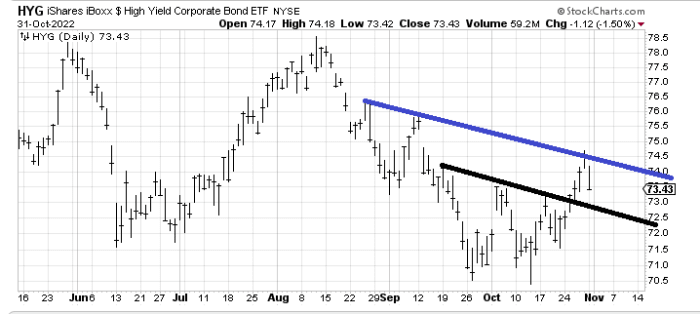
If you want to get upset over something, then keep your eyes on the high-yield bond fund
(HYG) – Get iShares iBoxx USD High Yield Corporate Bond ETF Report, which took a decent hit today. Tomorrow is the first day of the new month when
this bond exchange-traded fund goes ex-dividend, so it is often down on the first day of
the new month. For now, I would expect this to tag that black line around $72.50-$73 and
bounce again. Should it break that line by a decent amount, I would find that bearish for
the market overall. My impression is that it got to resistance (blue line) and is having a
typical pullback.
Down below you can see the 30-day moving average of the advance/decline line –- a more
intermediate-term overbought/oversold oscillator -— is not yet overbought. I can no longer
call it oversold, as it was in early October, but the math behind the indicator tells me
it should get the benefit of the doubt to get over the zero-line sometime this month.
Should that occur, we’d be looking at an intermediate-term overbought condition around
Thanksgiving.
For me to turn cautious on the market, as I did in early August, I would need to see
breadth weaken, with the McClellan Summation Index halting its rise and stocks acting
crummy. Right now, what I think we have is stocks have reached resistance and got short-
term overbought and now we’re having a choppy market with some downward bias.
The wild card of course is the Fed on Wednesday and then the employment report on Friday.
Obviously, that ought to make for a volatile week.
New Ideas
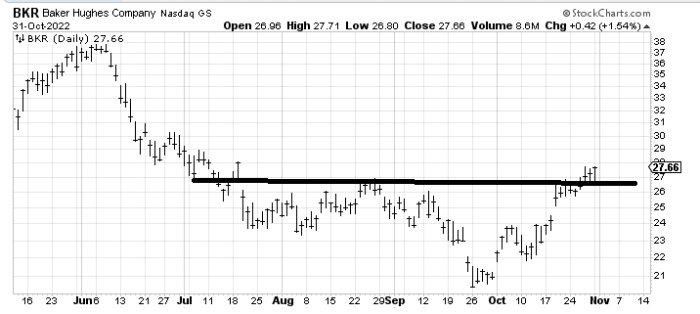
The chart of Baker Hughes (BKR) – Get Baker Hughes Company Report continues to shape up. While I drew that line and it
looks like a breakout, keep in mind there are layers of resistance to each through all the
way up to at least $30.
Today’s Indicator
The 30-day moving average of the advance/decline line is discussed in full above.
Note: There will be no Q&A/Reader’s Feedback section today due to time constraints. I
will, however, welcome your chart requests and this section will return tomorrow. Please
send requests.
Read More: Overbought and Underwhelmed


