


The Market
This is now two straight days that stocks rallied and bonds fell. Oh, I’m sure there were
plenty of other times, but these last two days are glaring, especially when the dollar has
been down, as well. All correlations eventually end, but stocks and bonds are generally in
agreement.
I still believe this week will be choppy and volatile.
Many believe the election results on Tuesday will move the market and I suppose it is
possible, but let me remind you that Thursday the consumer price index comes our way and
in the big picture, the CPI is more important to the market than the election.
Not much changed in terms of the indicators today. Breadth is pushing along. It is not
leading. I wouldn’t say it’s lagging, either. I would say it’s a bit like the movie Rocky
movies (the first one) where Rocky would run and Paulie would drive in the car along side
him.
Both just chugging along.
Remember the negatives start to arise when breadth falters and the indexes keep on going
(remember when Apple (AAPL:Nasdaq) ran in early August and everything else sat there or
turned lower? That’s what I’m talking about). For now the McClellan Summation Index is
heading upward, and would require a net differential of -3300 advancers minus decliners on
the New York Stock Exchange to stop going up.
Then there are the new highs. They are hanging in there for now. The S&P 500 is about 100
points under last week’s high and the new highs on the NYSE are currently at 79. The peak
reading last week was 98. Should the S&P 500 be so lucky as to get up to last week’s high
and there are fewer new highs than 98 I would consider that a negative.
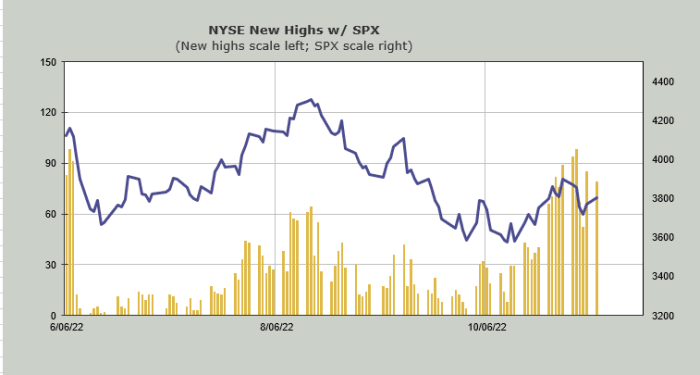
Down below you will see the 30-day moving average of the advance/decline line and it
finally crossed over the zero-line. My notes continue to say that this indicator should
get overbought around Thanksgiving. So that’s the guide. When this gets overbought, is
breadth still playing Rocky and Paulie, or is breadth lagging? Are new highs still below
that 98 peak reading from last week on the NYSE? Is the Summation Index still heading up?
As for the bonds, I still think we see a bond rally this week although clearly I was wrong
today. The Daily Sentiment Index is still 8. It’s just hard for me to believe that the
bonds keep heading lower with the DSI at single digits.
One final note on sentiment. After Fed Chief Jerome Powell’s presser last week the bullish
sentiment took a big breather (remember the equity put/call ratio jumped to 1.14 with the
total at 1.18).
But today the total put/call ratio fell to .88, which in the big scheme of things is not
anything of importance — except that it is the lowest reading since mid-September. My
take is that the bearishness that developed after the Federal Open Market Committee lasted
a day or two and is now gone.
New Ideas
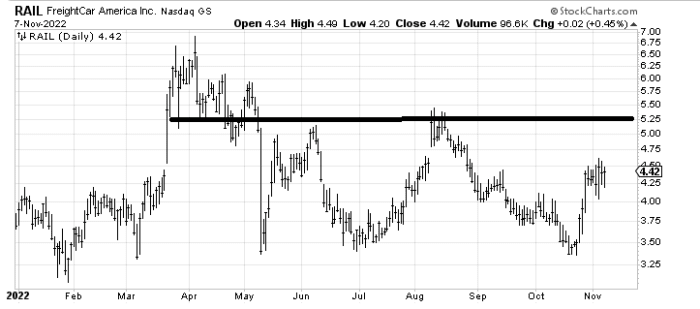
I typically stay away from low priced socks but the chart of Freight Car America
(RAIL:Nasdaq) caught my eye because it had a great pop and has held it sideways for more
than a week. Why couldn’t it try to rally to resistance at $5.25-$5.50? If I am wrong, I’d
get out quickly.
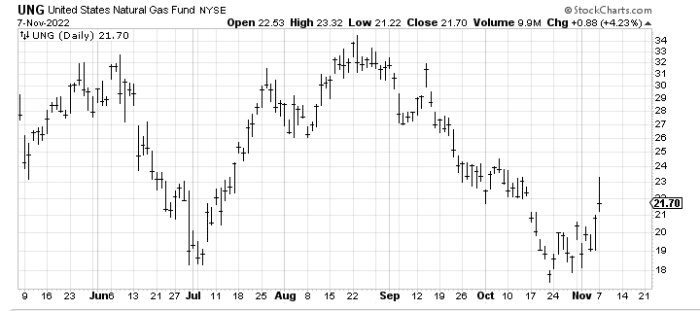
A few of you asked about United States Natural Gas fund (UNG) – Get United States Natural Gas Fund Report, which I recommended a
few weeks ago. It had a terrific pop today —- right into resistance. It already gave back
much of the pop but I’d still take something off the table.
Today’s Indicator
The 30-day moving average of the advance/decline line is discussed above.
Q&A/Reader’s Feedback
Helene welcomes your questions about Top Stocks and her charting strategy and
techniques. Please send an email directly to Helene with your questions. However, please
remember that TheStreet.com Top Stocks is not intended to provide personalized investment
advice. Email Helene here.
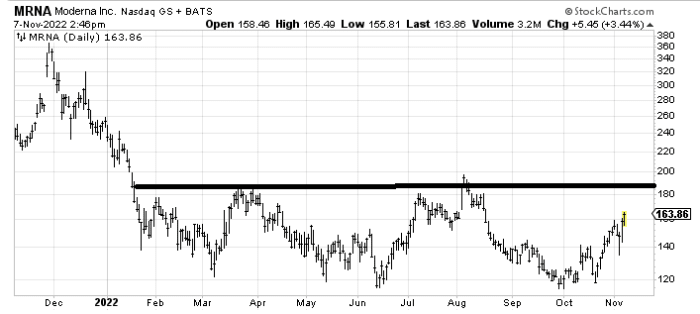
As you know, I have liked Moderna (MRNA:Nasdaq) for months in that I continue to think it
is forming a real base and has been working on it for the entirety of 2022. It would still
need to complete that base and so far that has been elusive. The resistance at that
$180-$190 area continues to be problematic, but in due time this really should breakout.
It just might take a while.
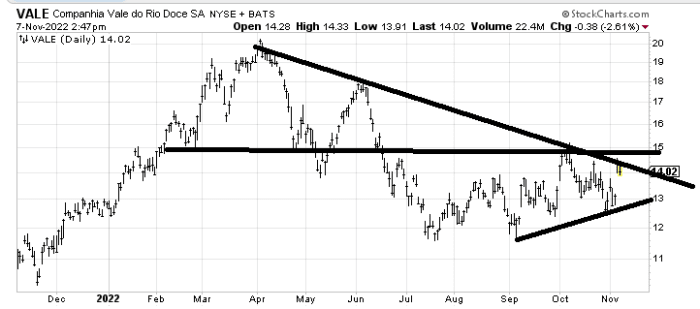
Vale (VALE) – Get VALE S.A. American Depositary Shares Each Representing one Report has decent resistance at $15, so until it clears that this sideways
action since last summer is just a weigh station. However, I’d probably buy a gap fill
just over around $13. Over $15 and the stock gets a whole lot more interesting.
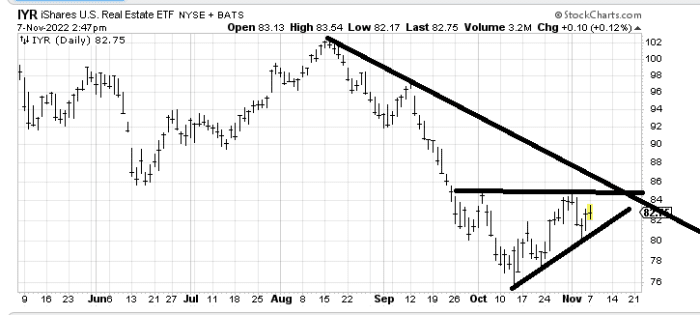
The iShares U.S. Real Estate ETF (IYR) – Get iShares U.S. Real Estate ETF Report is interesting. The risk/reward isn’t bad for
a trade. Under $80 and you’re wrong and over $85 and it could run to the low $90s.
Read More: When Breadth Goes the Distance


