


The Market
You see? Rally those mega-cap tech names and folks get all giddy again. OK, maybe not
giddy, but certainly we saw that gloom that had developed in the last few days lifted.
It seemed to me as if it was folks rushing to cover shorts as well as folks looking to get
exposure to the markets. Notice that what had been down rallied the most and what had been
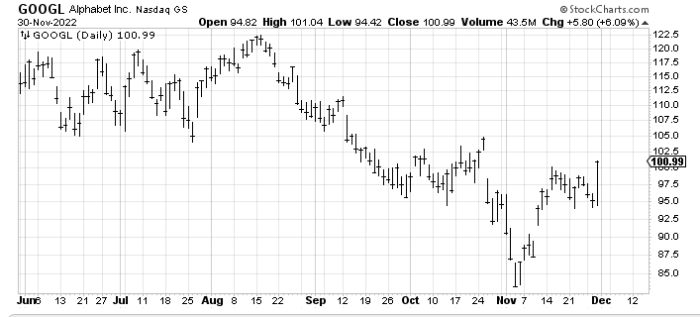
up was more tepid. That is one reason I keep noting that stocks like Amazon (AMZN) – Get Free Report;
Microsoft (MSFT) – Get Free Report and Alphabet (GOOGL) – Get Free Report needed to rally. They were so down and
out, and, without them rallying, we weren’t going to see the gloom lifted. So they rallied.
So did other tech.
And sure, we had a move in copper stocks and gold, but the majority of the big moves came
from tech-land. Notice the semiconductors did not make a higher-high. Why? They were not
down and out. Neither did the banks, which were so hot just a few days ago. And energy
lagged.
I like that the utilities rallied and that breadth is still good enough to keep the
McClellan Summation Index notching upward. But take a look at Cumulative breadth and you
will see that the S&P is now a mere 20 points from that early September high, while breadth
still needs a net positive 5,000 to achieve the same level.
The number of stocks making new highs is still lagging as it has yet to get over that 98
reading from early November. But I think the window is open for a few more days. Sure, we
have the minefield of the Core Personal Consumption Expenditure (PCE) Price Index on
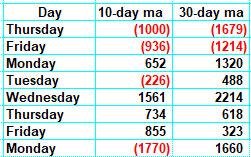
Thursday and the jobs report on Friday, but if we look at the table that shows what numbers
we are dropping from the 10-day moving average (short-term Oscillator) and the 30-day
moving average (intermediate-term Oscillator) we see big read numbers to drop Thursday and
Friday. But starting Monday, there’s not much red to drop; there is a lot more black
(positive numbers). That’s what makes us back to overbought, both short and intermediate
term on Monday.
And if that wasn’t enough, the Daily Sentiment Index for the Volatility Index is back at
16. That means if we can manage not to fall apart before Monday then early December should
bring us some volatility.
New Ideas
I am still looking for Alphabet (GOOGL) – Get Free Report to fill that gap in the $103-$105 area.
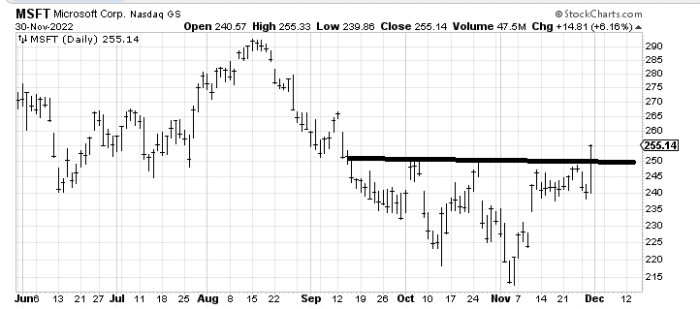
For Microsoft (MSFT) – Get Free Report I am looking for the gap near $265 to fill, but I want to use a
stop under $250 now, because if today was a fake-out instead of a breakout I don’t want to
hang around.
I do not have a target on Amazon yet. I still want to use a stop at those recent lows.
Today’s Indicator
The Volume Indicator is overbought.
Q&A/Reader’s Feedback
Helene welcomes your questions about Top Stocks and her charting strategy and
techniques. Please send an email directly to Helene with your questions. However, please
remember that TheStreet.com Top Stocks is not intended to provide personalized investment
advice. Email Helene here.
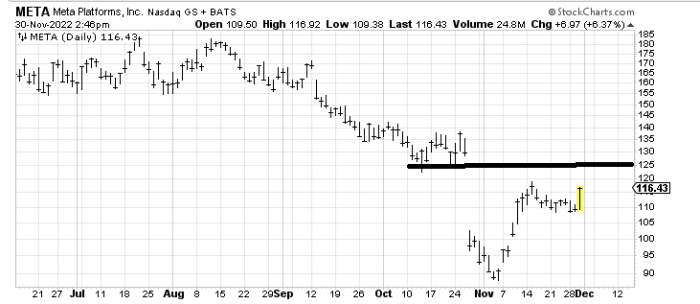
I did not think Meta (META) – Get Free Report could fill the gap on that early November rally, but now
that it has corrected I would say it has a chance to do so.
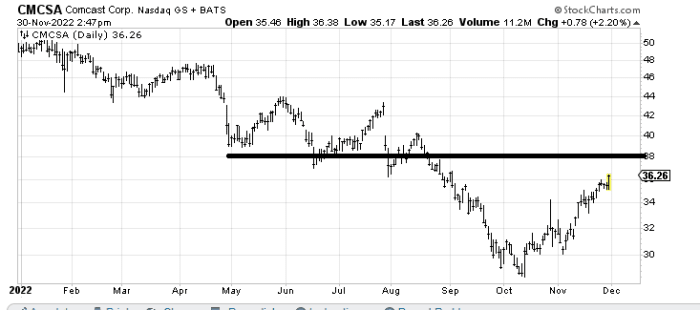
Way back in October, I turned positive on Comcast (CMCSA) – Get Free Report and was asked for a
target. It is heading into some resistance now. If it got to $38, I’d be a seller.
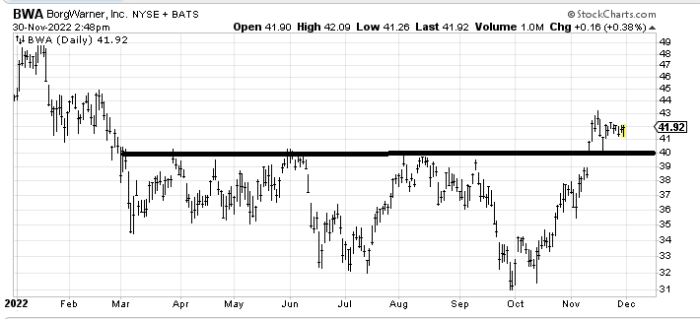
Borg Warner (BWA) – Get Free Report is an interesting chart, because it gapped up over resistance and
has held the gains after retesting the breakout. There is an upside measured target in the
$48-$49 area. It needs to chew through that resistance in the mid-$40s, but as long as this
stays over $40 it gets a chance.
Read More: A Ray of Sunshine in Tech-Land


