


The Market
I think this week will tell us a lot about the market as a whole. This is the week that
the short-term and the intermediate term oscillators I use are both overbought at the same
time. That doesn’t mean we have to go down every day, but if the market opts to rally most
days, then something has changed in the market.
You see, for this entire year, every time we were overbought as we are now, the market had
a pullback. Every time the CBOE Volatility Index (VIX) was down this far the market had a
pullback. So, if the market doesn’t have some sort of pullback in this week ahead, then
that’s a change.
Not to mention that a month ago everyone said the S&P 500 was going to 4,100 and with the
S&P at 4,071 we’re essentially there. So, if we rally over 4,100 will folks lift their
targets? If we rally over 4,100 surely everyone will highlight that we’re now comfortably
over the 200-day moving average line.
I have to also note that the S&P was red for five of the last six trading days yet breadth
was red only one of those days. That is the inverse of what happened in most of 2021. The
issue I have though is that the banks are still lagging after leading. The PHLX
Semiconductor Sector (SOX: Nasdaq) hasn’t made a new high. The Transports haven’t made a
new high and we all know the energy complex hasn’t made a new high.
My call is for a bout of volatility. It’s hard to imagine that the Daily Sentiment Index
for the VIX is at 15 and if the market rallies more it won’t fall and at least flirt with
single digits. You see I have rarely seen a DSI at single digits or over 90 where it
simply did not matter.
I would be more bearish if the McClellan Summation Index was heading down. But it has been
a champ and continues to be. It would require a net differential of -2,400 advancers minus
decliners on the New York Stock Exchange to halt the rise so sure one harsh day would get
it close but it needs two harsh days to really halt the rise.
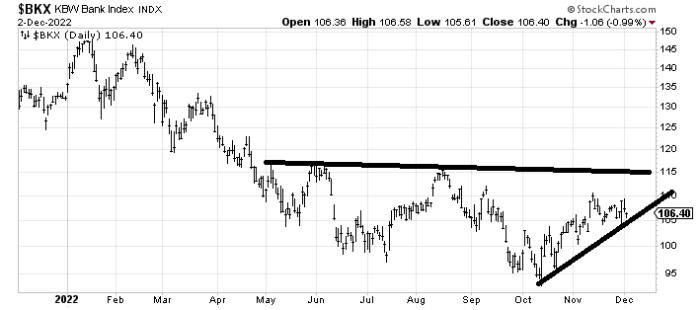
I have a close eye on the banks. You might remember I was a big fan of the banks a few
months ago, but they have been churning and acting quite sloppy for the last month. The
Bank Index couldn’t get over the early November high and now it is toying with the uptrend
line. If that line breaks, it’s a signal to me there is underlying weakness.
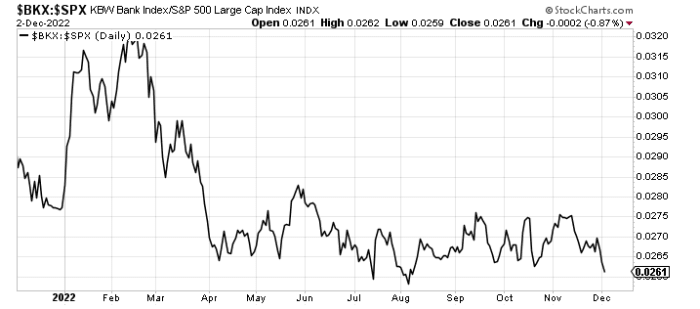
Because if I could take the chart of the Bank Index with the ratio of the Bank Index
relative to the S&P we see that this ratio is closing in on the August low. It is rarely a
great market when the banks are falling.
With the market so overbought and most stocks at resistance, it’s also hard to find
anything I have confidence in to go higher. So that leaves us with an overbought market
that is starting to feel a bit complacent, but I am willing to let it prove to me that it
doesn’t want to correct or give us more volatility.
In terms of complacency, the put/call ratios finally fell on Friday, indicating to me that
Friday changed some hearts and minds.
New Ideas
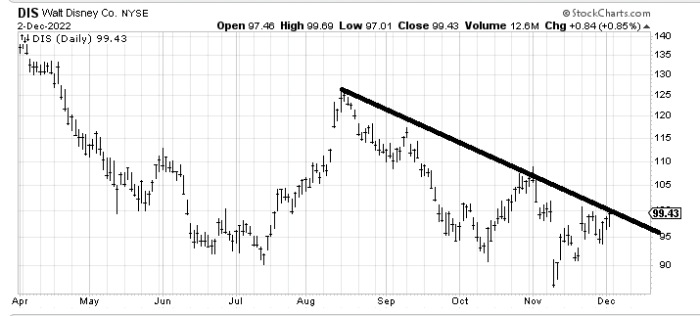
I want to follow up on Disney (DIS) – Get Free Report a stock I was asked about several weeks ago. It
tried to break down on the earnings and couldn’t. Then it tried to rally on the
appointment of the new (old) CEO and yet it finds itself right back where it started from.
If this stock can crack over this line, then I would say it is at least attempting a
bottom. It’s buyable but the stop is far away at under $92-ish.
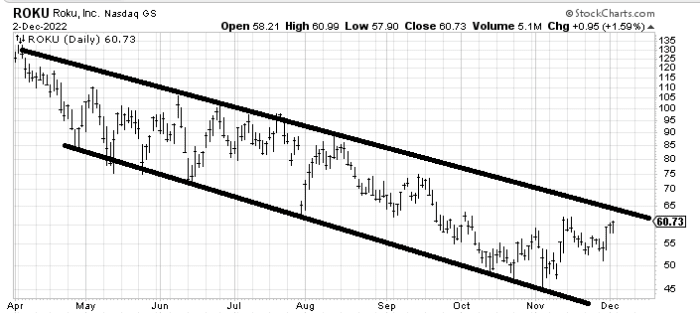
A few months ago I recommended Roku (ROKU) – Get Free Report when it got down to that lower line. It
popped, dropped and popped again. Mostly it has meandered its way upward as it is finally
approaching that downtrend line. I’d be a profit taker should it get to that $63-$65 area.
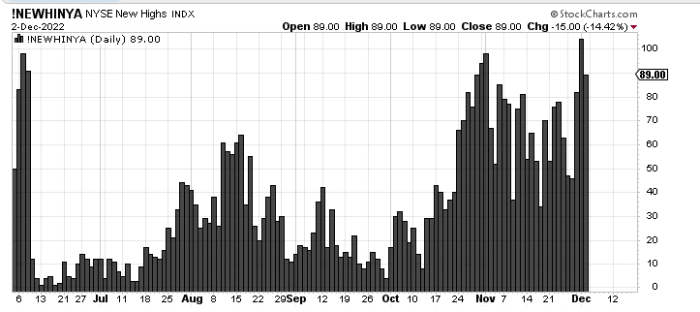
Today’s Indicator
The new highs continue to disappoint.
Q&A/Reader’s Feedback
Helene welcomes your questions about Top Stocks and her charting
strategy and techniques. Please send an email directly to Helene with
your questions. However, please remember that TheStreet.com Top Stocks
is not intended to provide personalized investment advice. Email Helene
here.
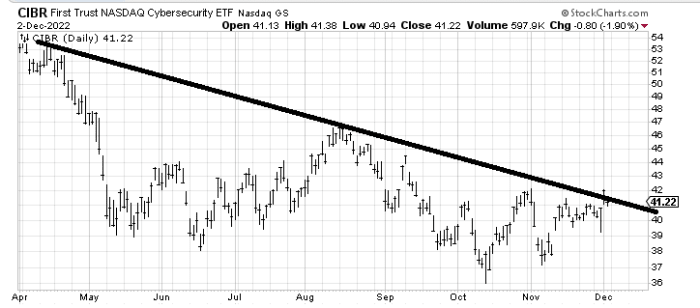
I do not love the chart of First Trust Nasdaq Cybersecurity (CIBR) – Get Free Report an ETF to be
long cybersecurity stocks. The reason is because the downtrend line isn’t great but also
because if it can clear $42 it still has a ton of resistance all the way up to $46. It
looks to me as if it can cross the line and then stall out anyway.
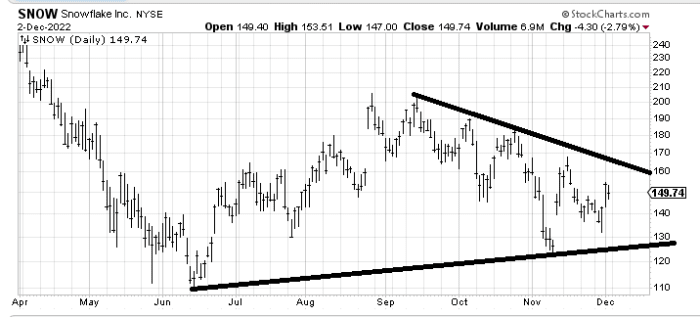
Snowflake (SNOW) – Get Free Report looks like it might be done going down but the upside is filled with
resistance for the next 50 points. I’d be inclined to sell it between $160-$165.
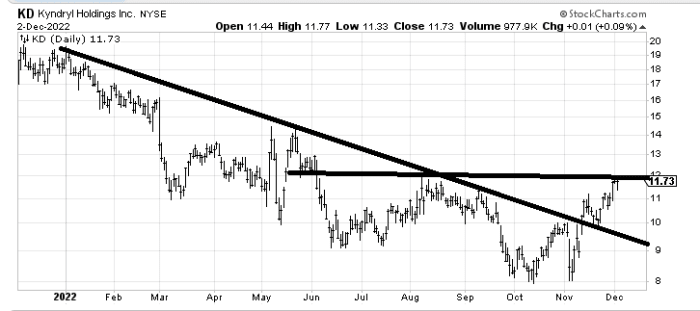
Kyndryl (KD) – Get Free Report is yet another stock that has crossed the downtrend line and run smack
into resistance. I don’t mind the chart, but it just has resistance all the way up so
there is no clear breakout to me even if it gets over $12. I can say this: if it doesn’t
clear $12 then it is likely just going to be a sideways play for a while.
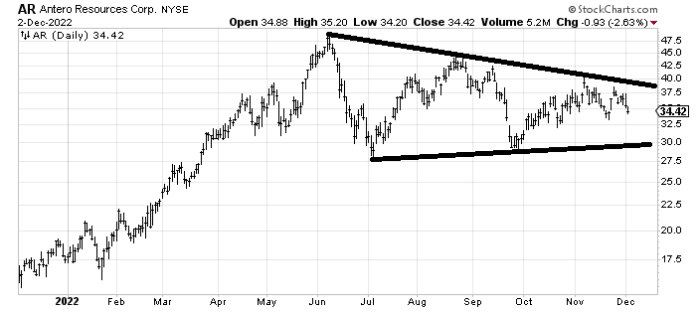
Antero Resources (AR) – Get Free Report has made a second lower high so unless it comes down to $30 and
bounces or clears $40 on the upside this chart is starting to look like a top to me.
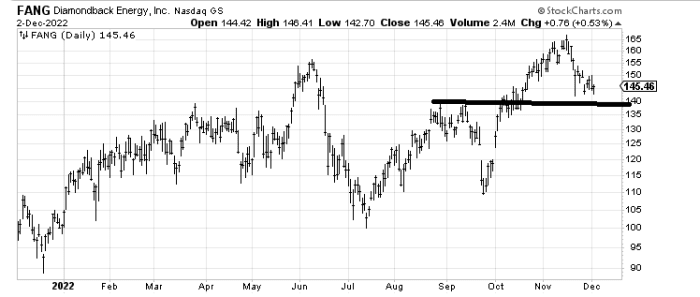
I don’t love the energy stocks but if Diamondback Energy (FANG) – Get Free Report can hold $140 on
this trip down I’d be impressed. It still looks too soon to be a buyer to me.
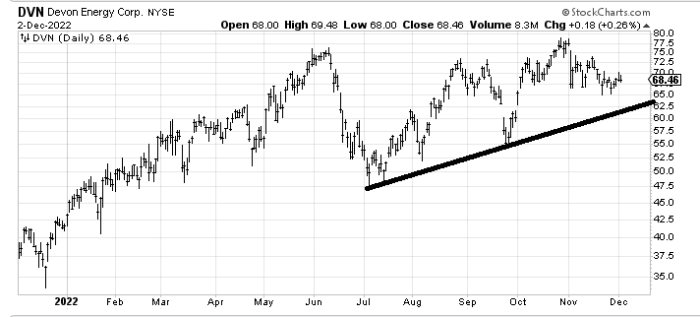
If Devon (DVN) – Get Free Report can come down and tag that uptrend line I’d get much more interested
in it. Right now it’s in no-man’s land.
Read More: Expect Pullback in Overbought Market


