


designer491
In my recent all-weather portfolio article series I included a healthy allocation of TIPS. It wasn’t based on a specific inflation prediction, rather the idea that an all-weather portfolio should contain assets that do well in different financial environments – including inflation, disinflation and deflation.
Here we take a deeper dive into the case for TIPS and ways to implement them. I’ll utilize John Bogle’s “Occam’s Razor” model and the CAPE ratio to generate potential return scenarios for the S&P 500 over the coming decade. Then we’ll look at what we might expect from TIPS. We will explore the tradeoffs for investing in individual TIPS bonds versus a mutual fund or ETF. The article concludes with a look at risks and entry points.
S&P 500 Expected Returns
In February of 2021, in “What Might John Bogle Expect From Today’s Market,” I utilized his “Occam’s Razor” method to generate a forecast of S&P 500 index returns for the coming decade. At the time we were still in a raging bull market that saw annual returns over the previous decade of 13.6%. Most pundits were still bullish just before the pandemic hit.
But the Bogle model suggested very subdued 10-year annual returns ranging from a pessimistic 1% to an optimistic 6.4%. The base case S&P 500 return was a paltry 3.2% per year. How has that played out so far? The combination of the 2021 total return of 28.7% and 2022 YTD return of -13.3% has resulted in an annualized return of 5.6%. But it is far too soon to declare victory for this model, given we are less than two years into the decade.
After this year’s selloff and recovery what might the model be telling us? The table below summarizes the possible scenario.
Author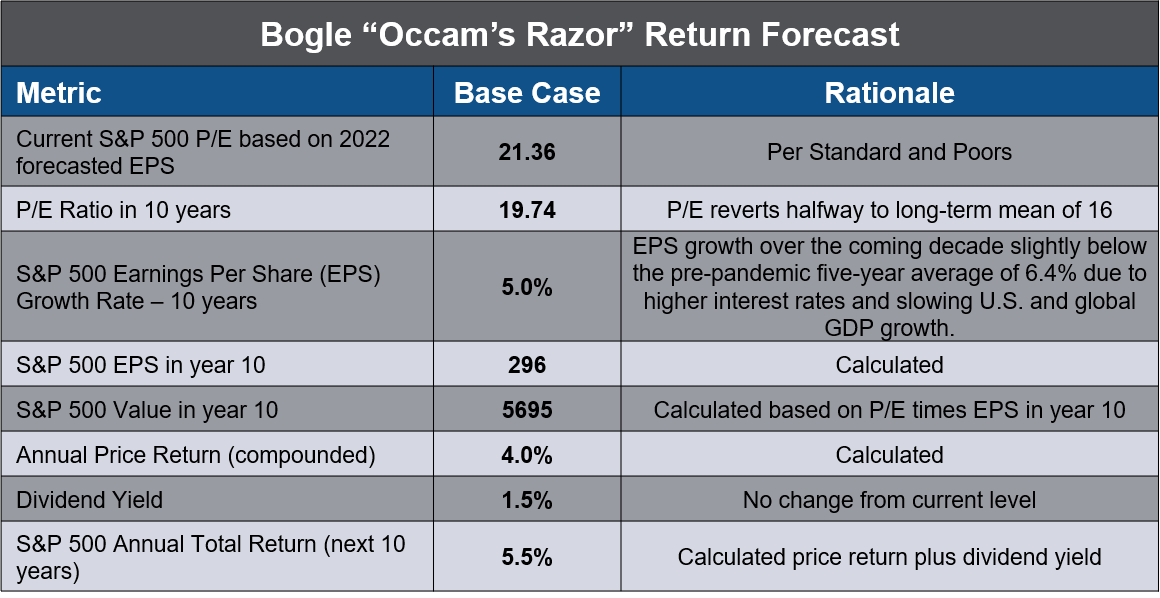
Based on this “reasonable scenario” the return forecast for the coming decade is about 5.5% per year. Recognizing a margin of error, given variable earnings and unpredictable P/E ratio movements, we might expect returns of about 4-7%. By way of reference, recently Vanguard forecast even slightly less optimistic U.S. equity returns for the coming decade of 3.4% to 5.4% per year.
CAPE Ratio Historical Data Also Suggest Muted S&P 500 Returns
Another way to gauge future returns is via the CAPE ratio. A word of caution: CAPE has its limitations. For one, the chart below shows CAPE has steadily increased over time. Therefore forecasts based on Shiller’s data series since 1871 have tended to underestimate future returns.
multpl.com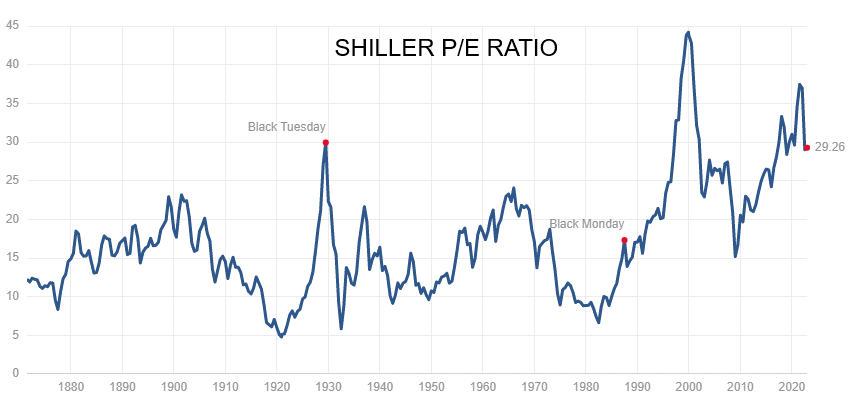
“The Best Market Indicator Over the Last 34 Years,” illustrates the lack of CAPE’s usefulness as a short-term timing tool. Indeed, Shiller’s data show the inverse correlation of CAPE with expected returns is stronger over longer time frames.
However, according to “The Remarkable Accuracy of CAPE As a Predictor of Returns,” if we use the CAPE data from 1995-2020, the model’s accuracy goes up considerably.
Advisor Perspectives, The Remarkable Accuracy of CAPE as a Predictor of Returns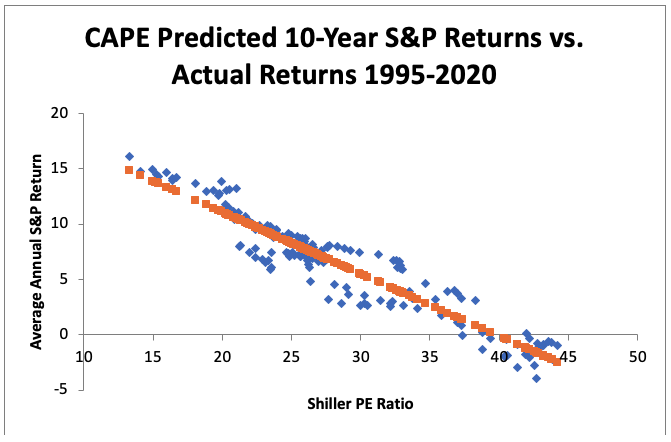
Since 1975, the Shiller CAPE has explained 85% of variation in future stock returns. Those data have accurately forecasted returns within +/-1.37% for 67% of the time. Combining today’s CAPE value of 29 with those data indicate returns of 5.89% per year in the coming decade.
In summary, the Bogle and CAPE methods suggest S&P 500 annual returns over the coming decade of about 4-7%.
TIPS and the Inflation Outlook
Now let’s turn to TIPS and possible inflation scenarios. Expected returns for individual bonds equal the real rate plus inflation over the life of the bond. The chart below shows real yields since 1980.
FRED
In early November, the 10-year real TIPS yield was over 1.7%, the highest since 2009. Hopes of a Fed pivot have brought the rate down considerably – to about 1.2% on the 10-year TIPS as of this writing. Yields on the secondary TIPS market for 5 and 20 maturities are comparable at 1.4%.
Now for the hard part – expected inflation. Powell and the Fed were humbled after their repeated assertions of “transitory inflation” in 2021. Last week Powell conceded, “The truth is that the path ahead for inflation remains highly uncertain.”
Nonetheless, they must survey and make their best guess forecasts. The NY Federal Reserve survey indicates consumer inflation expectations for the next three years at 3.11%. The University of Michigan 5- to 10-year inflation expectations outlook is comparable at 3%. The bond market’s implied inflation rate, or breakeven over 10 years (10-year Treasury rate of 3.8% minus the 10-year TIPS rate of 1.2%), is an even more benign 2.6%.
However, a recent article from Research Affiliates, “History Lessons: How “Transitory” Is Inflation?” paints a less rosy picture:
- “The U.S. Federal Reserve Bank’s expectations for the speed of reverting to 2% inflation levels remains dangerously optimistic.
- An inflation jumps to 4% is often temporary, but when inflation crosses 8%, it proceeds to higher levels over 70% of the time.
- Reverting to 3% inflation, which we view as the upper bound for benign sustained inflation, is easy from 4%, hard from 6%, and very hard from 8% or more. Above 8%, reverting to 3% usually takes 6 to 20 years, with a median of over 10 years.”
The last point is particularly telling. Inflation passed the 8% threshold earlier this year. If history is an accurate guide, we may not see 3% or lower inflation for another decade. Last week NY Fed President John Williams also hinted of this, saying inflation could remain elevated until 2025. Perhaps he also read the Research Affiliates paper.
The 1940s – Accommodative Policy Allowed Higher Inflation
There is an interesting parallel that Lyn Alden and Ray Dalio have cited – the 1940s. The gigantic deficit spending to finance World War II was similar on a relative scale to the COVID stimulus. The 1940s policy actions led to accelerating inflation and Fed yield curve control.
During the 1940s, inflation averaged 5.5% but was volatile, ranging from -2% to +18%. The Fed kept long rates well below inflation during most of the period – at no more than 2.5%. As a result, nominal bond investors suffered negative real returns for ten years. Note that TIPS didn’t exist in the U.S. until 1997.
Author, inflationdata.com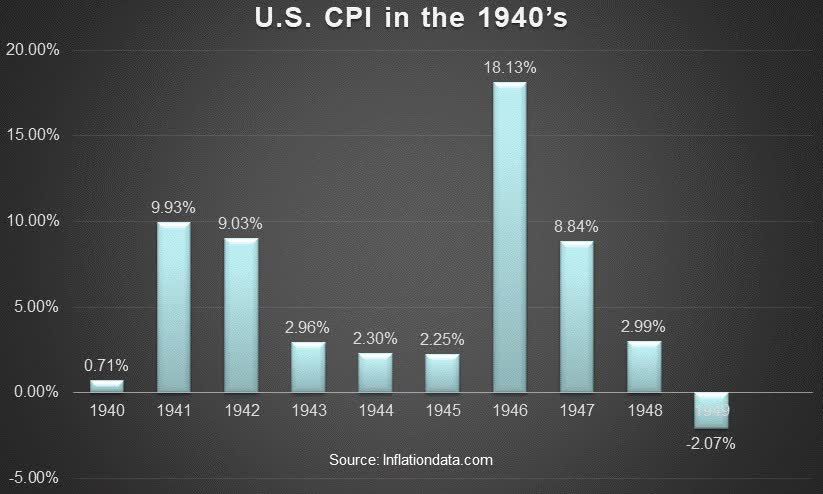
Today’s official published Federal debt of almost $31 trillion equals 123% of GDP. “This Time is Different: Eight Centuries of Financial Folly” demonstrates when debt reaches such levels where it cannot be paid off in today’s real dollars governments invariably inflate their way out of it. That was the method employed by the United States in the 1940s when federal debt to GDP reached 110%.
The 1970s/Early 80s – Volcker Crushed Inflation With Tight Policy
Before the 21st century era of financial repression, real rates averaged 2-3% in normal, non-inflationary times. Debt to GDP was a much more reasonable ~30% of GDP in the 1970s. Private sector debt was also well below today’s levels. That allowed Paul Volcker to adopt an aggressive stance to crush inflation without waylaying the government’s budget and destroying the financial system. Volcker ran the Fed funds rate up to a peak of 22% while peak inflation reached a much lower 13.8%. The chart below shows that the Fed maintained this strong disinflationary policy by keeping the Fed funds rate well above the CPI for all of the 1970s until the two levels coincided briefly after the 1980 recession. As a result, inflation receded to less than 4% in 1982.
FRED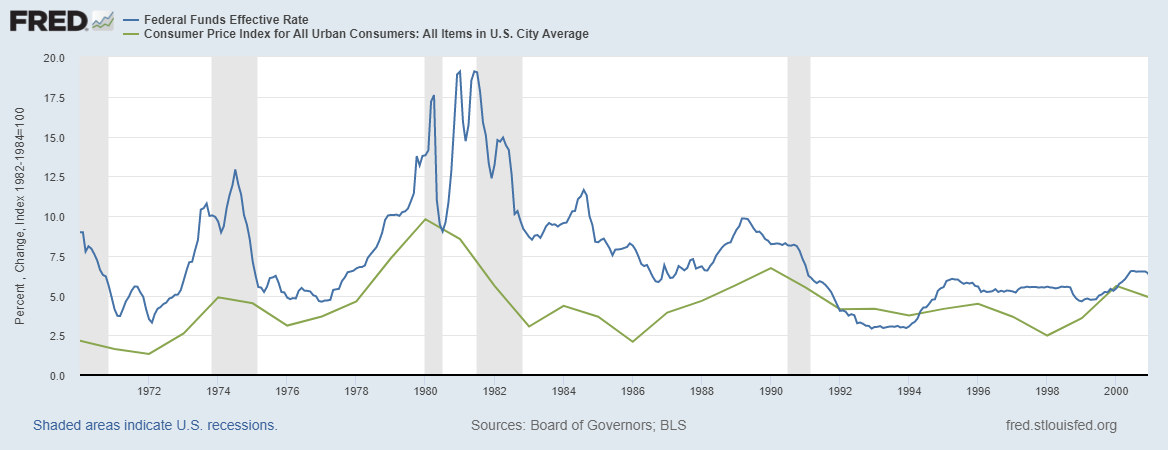
Today’s Fed Policy – Talk Tough, Act Moderately
Now let’s turn to today’s situation. If the Fed brought real rates to zero – hardly an inflation fighting level by comparison to Volcker’s – the funds rate would need to be 7.7% (based on recent inflation data). Yet, the current “inflation fighting” policy rate is 3.75-4%. It is widely expected the Fed will boost by 50 basis points to a range of 4.25%-4.50% this month. That’s still a substantially negative real yield and highly accommodative by historical standards.
Yet recent Fed-speak cites an expected terminal peak Fed Funds rate “over 5% next year.” So does the Fed really expect inflation to drop below this rate without more aggressive action? At no point in history did inflation come down that dramatically with persistent and substantial negative real rates.
So what gives? The answer is evident if we play what if. Let’s say the Fed wanted to adopt a more serious inflation fighting policy with a positive 2% real yield. And optimistically let’s say inflation continues to moderate to 5%. Then a slightly restrictive rate by historical standards might be two points above inflation, or 7%. That’s a three-percentage point increase from today. If that were maintained, it would eventually translate into an additional $930M (3% of $31 trillion) of interest added to annual federal budget. That would be on top of the existing annual interest amount of $475B. To put that in perspective, healthcare is the government’s second largest budget item at $914M, accounting for 15% of the total. The effect on the federal budget would be catastrophic.
We also must consider that this year’s four percentage point increase still hasn’t worked its way into Treasury department refinancing and government budget numbers.
Then there are the profound negative effects on the private sector. Such severe tightening would likely result in some combination of:
- Government debt crowding out private sector investment
- Burdensome tax increases on businesses and consumers
- Recession and economic hardship
- Declining corporate earnings and share prices
- Risk of accidents in vital financial sectors
- Real threats to dollar viability
One can readily see that this would be a disastrous and infeasible approach. This reality combined with the experience of the 1940s suggests the most likely scenario is for the Fed to take the middle ground of moderate, but somewhat feeble policy tightening. This is likely to result…
Read More: TIPS Performance Could Rival That Of The S&P 500 Over The Next Decade (NYSEARCA:TIP)


