


The Market
It was a day of chop and the only thing that really moved were bonds. I have no reason to
dislike bonds here. Have they run too far? Yes. But have they done anything wrong? No. And
sentiment has shifted, but not enough for it to be anywhere near extreme.
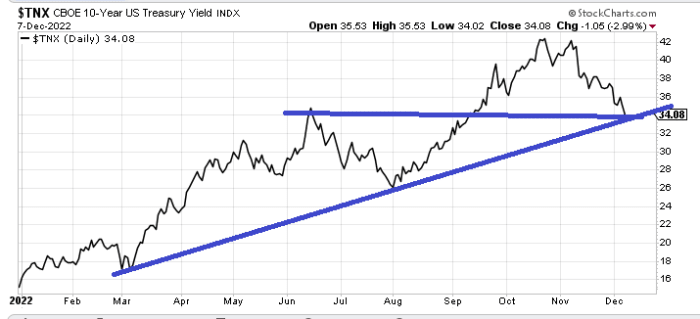
That said when we look at the yield on the Ten Year we are coming into some decent support.
So bonds need a little respite in my view.
Away from that, there was very little change in the indicators. We are coming off those
overbought readings we entered the week with and the S&P has now been red for five straight
days and eight of the last nine days so again, a bounce is likely at some point but until
my indicators cycle back to oversold and sentiment gets super bearish again, I still think
we’re in a correction mode.
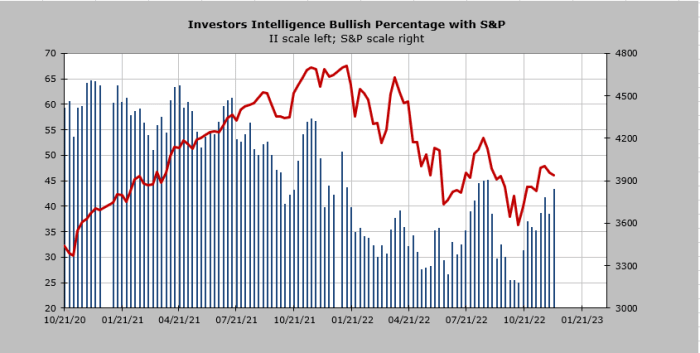
On the sentiment front, the Investors Intelligence bulls scooted up to 43.5% this
week, which is the highest since August. But we know they do not encapsulate this week’s
trading. Tomorrow we’ll get a fresh read with the American Association of Individual
Investor survey and National Association of Active Investment Managers, which I fully
expect will show a shift toward more caution. Keep in mind that even though the II bulls do
not reflect this week’s action, they still will need time to cycle back to more bears and
fewer bulls.
I want to conclude with one piece on sentiment. At this time of the year the major
investment houses put out their year end 2023 S&P targets. I noticed the other day that of
the 16 that have published S&P targets for 2023, 11 are looking for 4100 or lower. Two are
at 4200. That leaves a mere three strategists that are looking for the market to be up more
than a few percent next year.
I don’t have any statistics on how to game this but my intuition says to me that’s pretty
lopsided and tilted to the bearish side. Can they all be right? It’s something to ponder
when you think that we are now nearly two years into the bear market for most stocks.
New Ideas
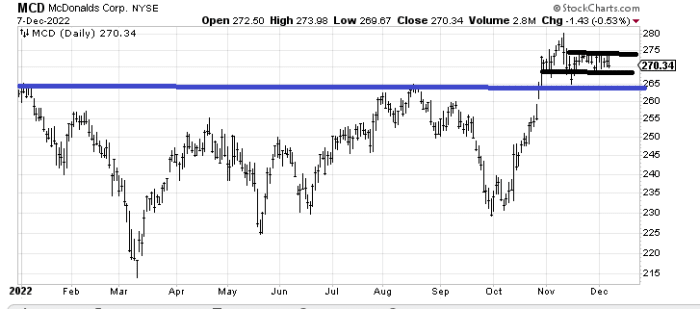
I have been staring at McDonald’s (MCD) – Get Free Report, which has been trading in a two-point range
for nearly three weeks now. Given my view on the market, I would say it likely drops out to
the downside, but that’s what I have my eye on, because that blue line was a breakout and
it hasn’t done anything since it broke out. Was that a fake out?
Today’s Indicator
The Volume Indicator is back at 51%, so here’s an indicator that is working off the
overbought reading. You can see though, it will take more to get it back to oversold.
Q&A/Reader’s Feedback
Helene welcomes your questions about Top Stocks and her charting strategy and
techniques. Please send an email directly to Helene with your questions. However, please
remember that TheStreet.com Top Stocks is not intended to provide personalized investment
advice. Email Helene here.
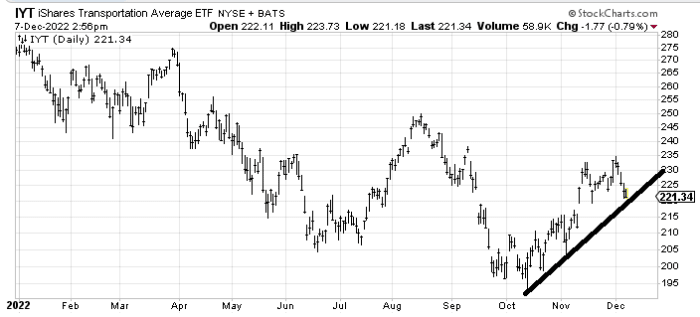
Using the iShares US Transportation ETF (IYT) – Get Free Report instead of the actual transportation
index the uptrend line hasn’t broken yet. Breaking it is not dire, but I do expect it will
break at some point in the next few weeks. That gap fill around $215 should be first
support. And if by then we are back to an oversold condition, then I might have an interest
in buying it there but that would be my first target once that line breaks.
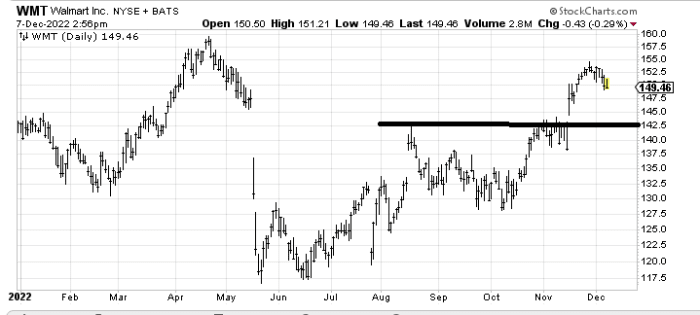
Longtime readers will recall my view that retailers tend to peak in the first few weeks
after Thanksgiving, before Christmas. Walmart (WMT) – Get Free Report would be in that category mostly
because it has had a terrific run and is smack up against resistance. My sense is we will
see it come back to fill that gap and test support around $142-$143.
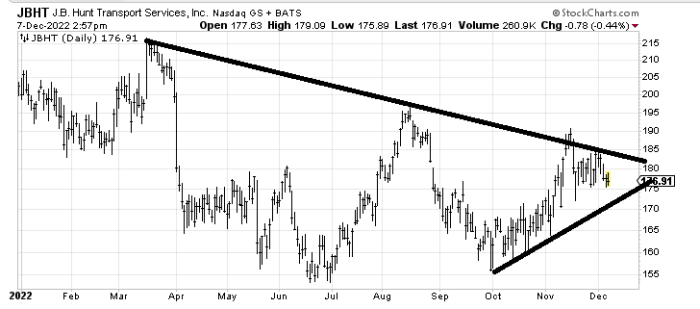
JB Hunt (JBHT) – Get Free Report is an interesting chart that I am watching closely. I would like to
see the stock come down and tag that uptrend line and if it can hold it I sense I will like
the stock down there. After all the price of diesel has come down quite a lot so they ought
to benefit at some point.
Read More: Bond Relief


