


Dilok Klaisataporn
The S&P 500 is set to end 2022 with negative returns. It is exceedingly rare that the S&P 500 experiences consecutive negative years. This is especially true in the modern era. The last time it recorded back to back years of negative returns was 2000-2002, in the aftermath of the Dotcom crash.

Charts by TradingView (adapted by author)
Despite the steep odds, I’m sticking with my gut and making a bold call: the S&P 500 will be lower by the end of 2023.
I wrote about this subject in my previous article Don’t Fight The Fed, Sit On Cash. In it I compared today’s markets with those of 2001 and 2007. This is what I said:
Next week the Fed is expected to announce a 75 basis point increase to the Fed Funds rate, putting it above 3%. Figure 3 from the article shows that the Fed Funds Rate has reached a neutral policy state, the first time since 2018. Both 2002 and 2008 were characterized as restrictive policy states. Continued monetary tightening is on the path toward a restrictive state.
The problem for risk assets is that asset appreciation has been significantly contingent upon the concept of There-Is-No-Alternative because risk-free rates have been so low. Rates are now climbing into territories that offer substantial income which is raising risk premium across asset classes.
On December 14th, the Fed again raised the Fed Funds rate, this time by a stepped down 50 basis points. Equity markets anticipated this policy change with jubilee. My concern is that monetary policy has tightened very quickly, the fastest in decades. It takes time for tightener monetary policy to work its way through the economy and ultimately affect equity earnings and valuations. Due to this lag, equity markets tend to end their bear markets after tightening has finished, and somewhere in the middle of subsequent recessions.
Where are we today? Just the beginning.
Markets seem enamored with the idea that degrading economic data is bullish because it means the Federal Reserve will ease monetary policy and bring back the liquidity that the market craves. That may have worked in 2020. But in 2023, recession is not bullish.
When Bear Markets Usually End
U.S. equities are in a bear market. The question is, what kind? Using history as a guide, we can examine a few patterns. Typical bear markets tend to end with the following conditions:
- 3-6 months after a recession has begun or about halfway
- After interest rate hikes have concluded
- Unemployment rises by 1-2%
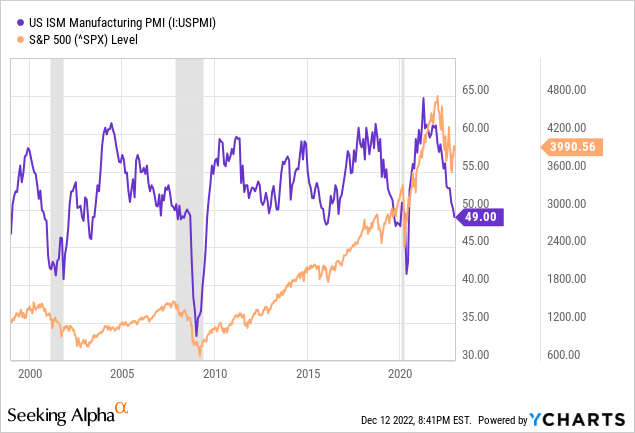
- ISM Manufacturing PMI is below 50
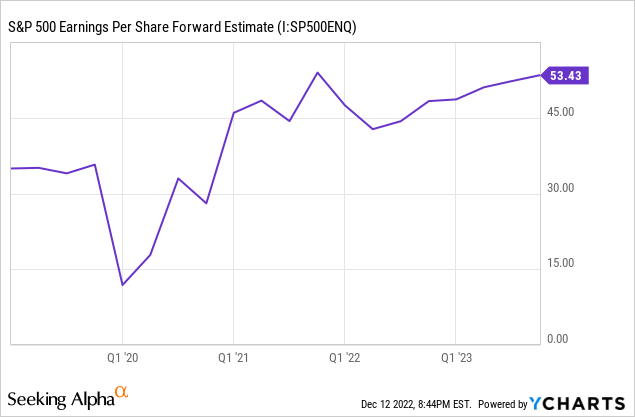
- EPS estimates have declined by more than 10%
At present, most of these conditions have not been met. It’s possible that a recession in the U.S. has already started but the NBER has not declared one. The Fed has not announced the end of rate hikes nor has unemployment materially risen. The ISM Manufacturing PMI only recently fell to 49 while earnings estimates have declined marginally.
I’ve written before about how the monetary and economic conditions are similar to those leading up to 2008 and 2002. Personally, I think markets today most closely resemble those of 2001. Taking a closer look at both of these time periods we can observe a few patterns.
In 2006-2009, the Fed paused rate hikes shortly before unemployment bottomed. Next, the Fed pivoted and started cutting rates. Over a year later, unemployment rose by 2%. Then, the PMI bottomed just as rate cuts were bottoming. Finally, the S&P 500 bottomed in March 2009, after the NBER declared a recession was underway in December 2008.
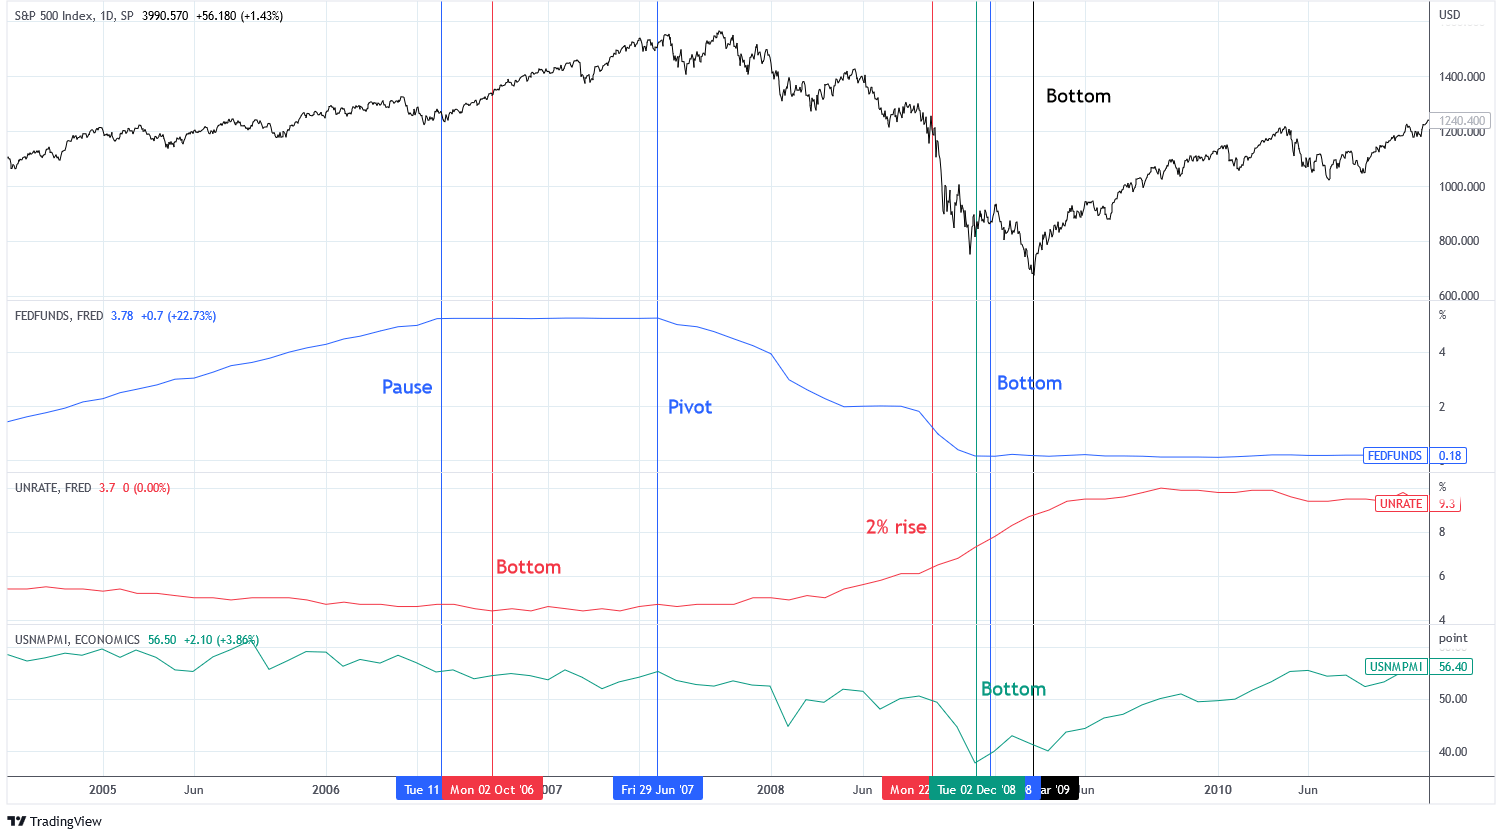
Charts by TradingView (adapted by author)
In 2000, unemployment bottomed shortly before the Fed paused rate hikes. The Fed then pivoted almost a year before the PMI bottomed. Rate cuts ended shortly thereafter and unemployment rose by 2%. The S&P 500 bottomed in October 2002 after the NBER declared a recession in March 2001.
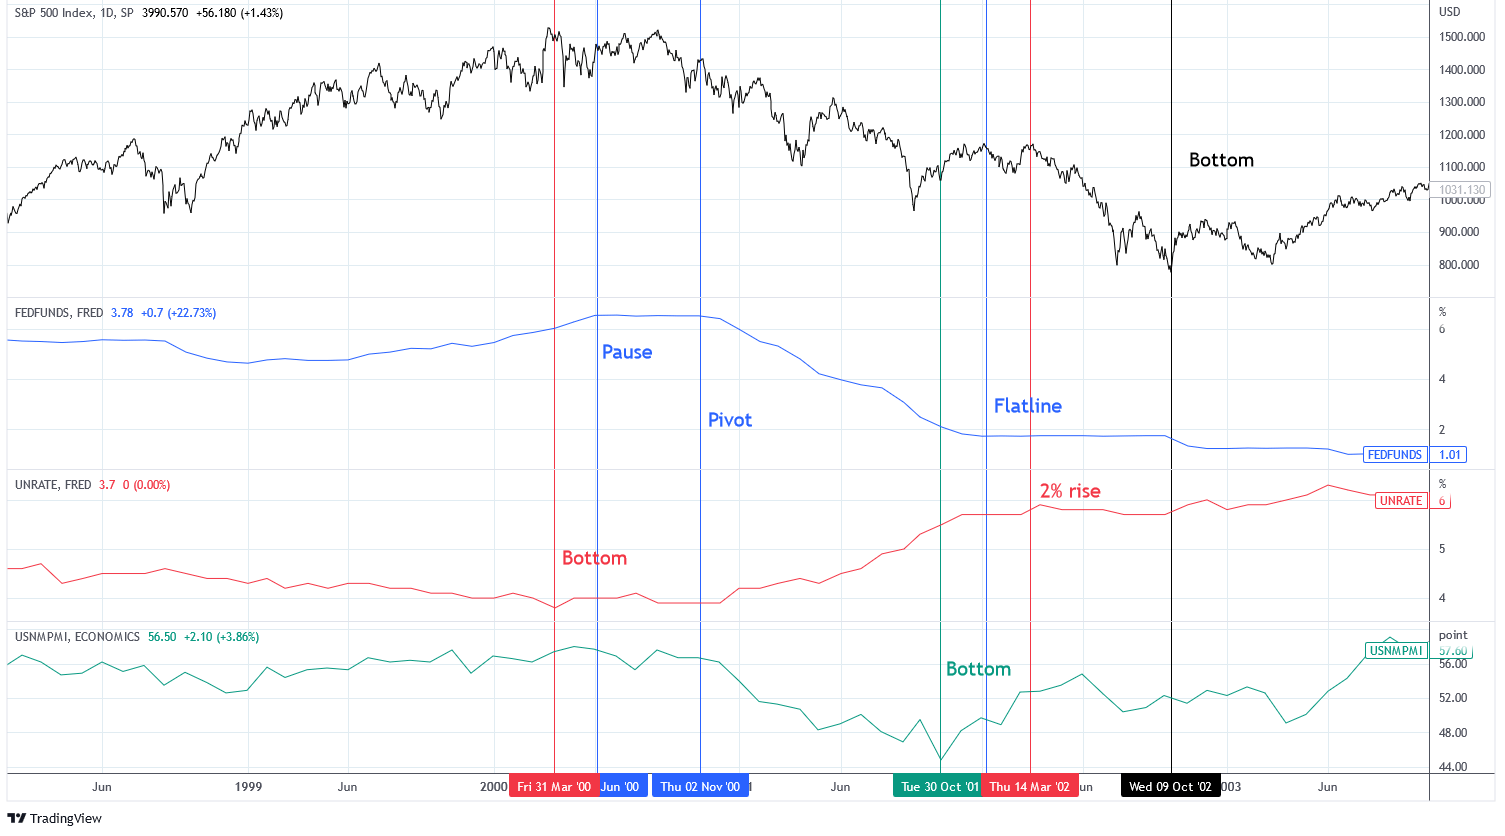
Charts by TradingView (adapted by author)
Looking at today, NBER has not declared a recession, despite data that supports it (we’ll discuss that in a moment). The Fed has not paused, although many speculate that the 50 basis point hike in December was their last. I disagree. At the latest FOMC meeting, the Fed revised its core PCE forecast upwards, signaling that they are not satisfied with the current progress in inflation. The PMI doesn’t look like it’s bottomed as leading data suggests there’s more weakness to come. Unemployment has likely bottomed at 3.5% and stands at 3.7% today. Nothing about this setup looks like equities should bottom here.
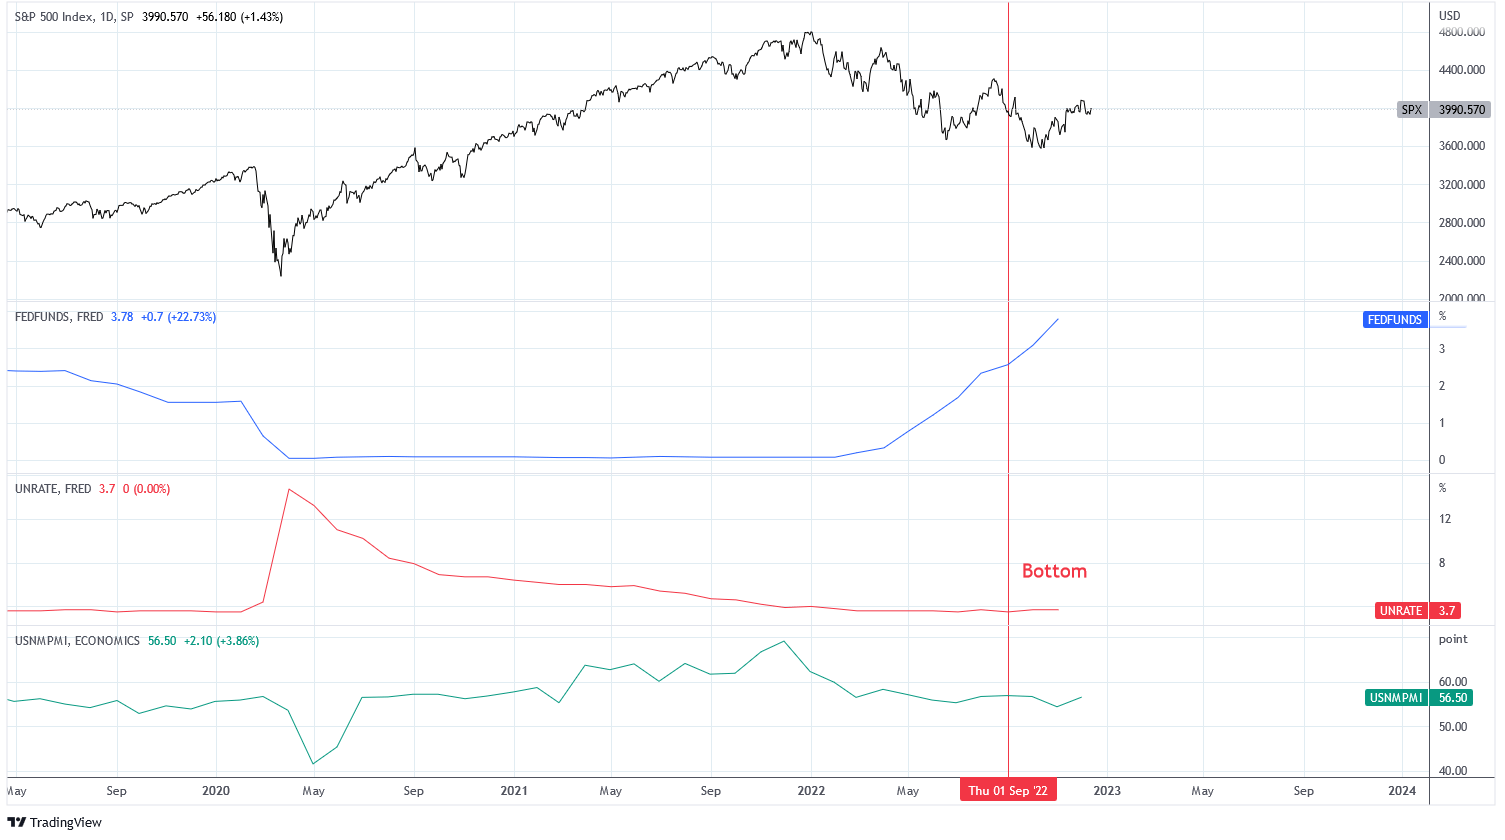
Charts by TradingView (adapted by author)
Here is a look at the cyclical nature of employment and its relationship with the S&P 500. During the last three recessions the S&P peaked as unemployment bottomed and bottomed midway through the rise in unemployment. This is because equity markets are forward looking and anticipate the end of the recession in advance.
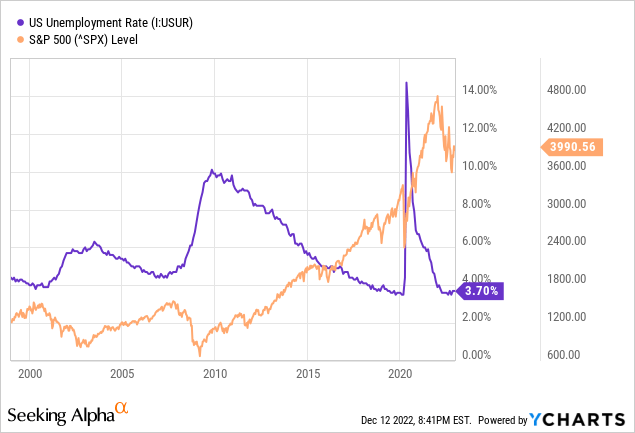
In contrast, the ISM manufacturing PMI often bottoms with or before equity markets. This is because employment is a lagging economic indicator and the ISM PMI index is a leading economic indicator. If we are heading for recession, the index is not likely to bottom at 49. Notice that in 2001 the index bottomed twice, nearly 12 months apart.
Consensus EPS estimates are still expecting a 5.0% YoY increase to earnings in 2023. These estimates have now declined by 4.2%. I believe these estimates are still too generous, as we’ll discuss next. I am expecting negative earnings growth in 2023.
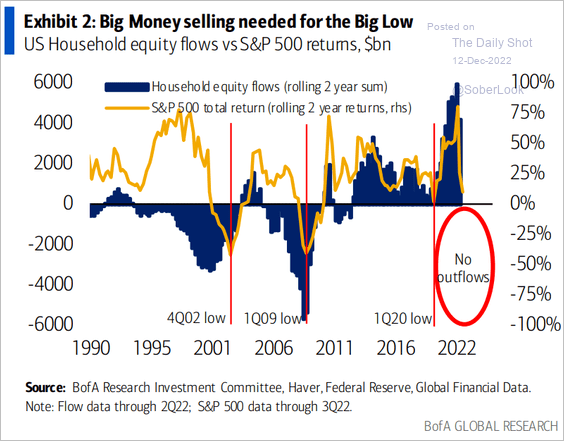
Finally, the market doesn’t pass the eyeball test. The market continues to behave like a bear market with ripping bear market rallies in a continued downtrend. The overall sentiment is still overly bullish and the buy-the-dip mentality has not faded. For a bottom in equities I would expect capitulation, which would express itself in capital flows. Thus far, we have not experienced significant capital outflows in equity markets, despite the broadly large cash positions. I expect much of this cash will end up in bonds, not equities, with attractive rates and a macroeconomic environment that favors bonds. I think that the market is currently in the “denial” phase of this market cycle, in accordance with the illustration by Wall St Cheat Sheet.
The Daily Shot (used with permission)
Most Anticipated Recession in History
This recession is possibly the most widely anticipated recession in history. Everyone is talking about it. Even the Fed is talking about a “possible” recession. The data is clear; recession appears inevitable. It is possible that this recession is already priced in. Rather, I think market participants believe its priced in when it actually is not.
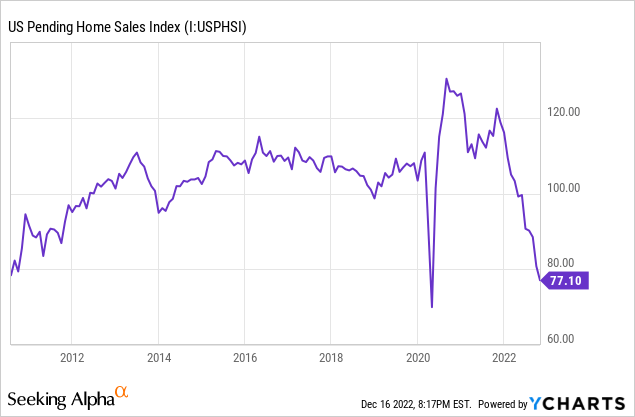
To begin, the U.S. housing market is exhibiting significant weakness. This is a result of dramatic increases to mortgage rates. Pending home sales have fallen off a cliff with the Pending Home Sales Index falling to 77.
As a consequence, U.S. residential fixed investment has contracted sharply. RFI is a leading indicator for the ISM non-manufacturing index because housing drives the overall economy as a major sector for job creation while homebuyers tend to increase spending on home-related goods and services. RFI is suggesting that ISM non-manufacturing will fall to 50 in 2023. This is similar to what was experienced in 2002.

The Daily Shot (used with permission)
The National Association of Home Builders index has also fallen off a cliff. The NAHB is inverted in the chart below and tracks closely with initial jobless claims, again because “housing is the business cycle” and supports a substantial number of jobs. The index is suggesting a rise to weekly initial jobless claims of ~200,000.
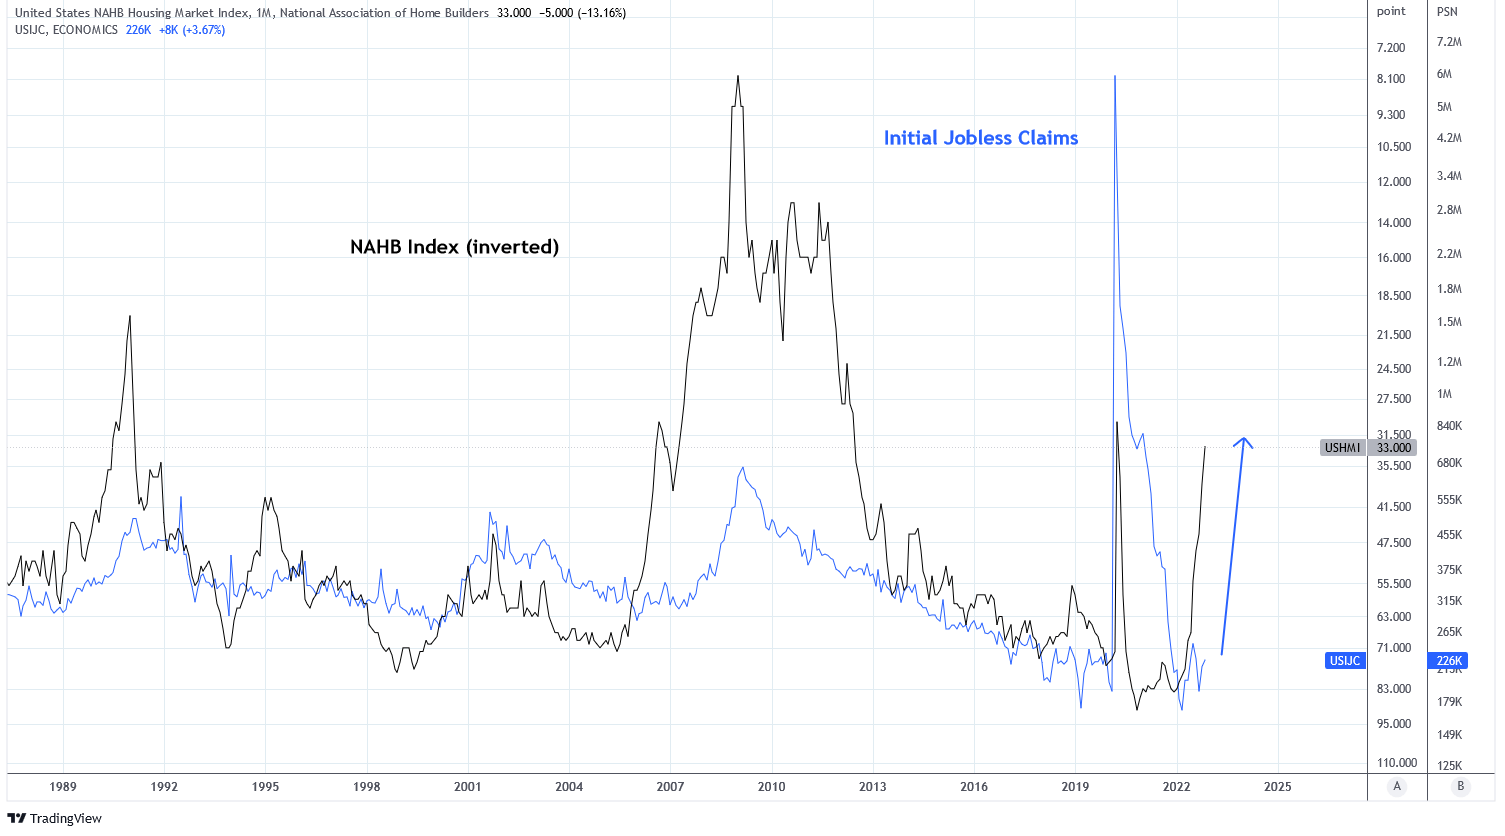
Charts by TradingView (adapted by author)
This forecast is supported by other leading indicators of employment. The Challenger job cuts announcements tend to lead rises in jobless claims and is suggesting that jobless claims could increase by 40% YoY in 2023. To make matters worse, the Federal Reserve of Philadelphia released data on December 13, 2022 that suggests the BLS labor statistics in the first half of 2022 were grossly overestimated. The report states that “10,500 net new jobs were added during the period rather than the 1,121,500 jobs estimated by the sum of the states.” This suggests that employment may be much closer to a recessionary condition than at first glance.
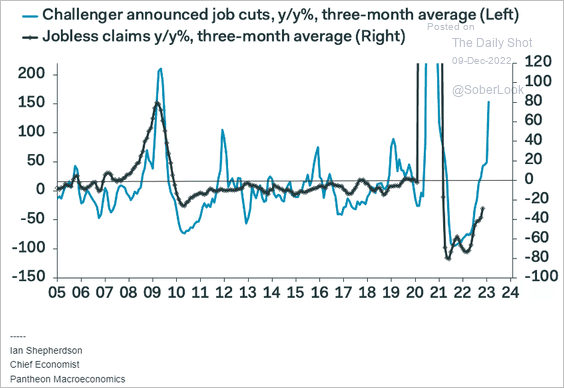
The Daily Shot (used with permission)
Employment, although an important characteristic of recession, is a lagging economic indicator. Leading economic indicators are already signaling recession. This includes the real gross fixed capital formation in the U.S. When the quarterly change to real GFCF is deeply negative for consecutive quarters it tends to correlate with recession. Real GFCF for Q2 2022 was -1.3 QoQ and -0.97% QoQ in Q3 2023. In 2002, the worst quarter was Q3 at -1.25% QoQ.
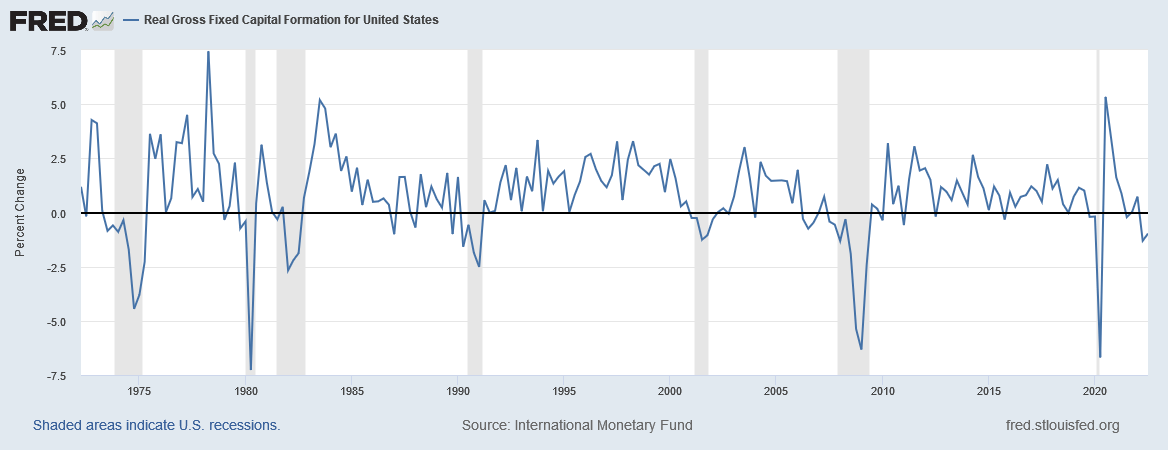
Federal Reserve Economic Data | FRED | St. Louis Fed
Another indicator is the percent of U.S. domestic banks willing to make consumer installment loans. Declines to this percentage typically correlate with recession and a decline was experienced in 2022.
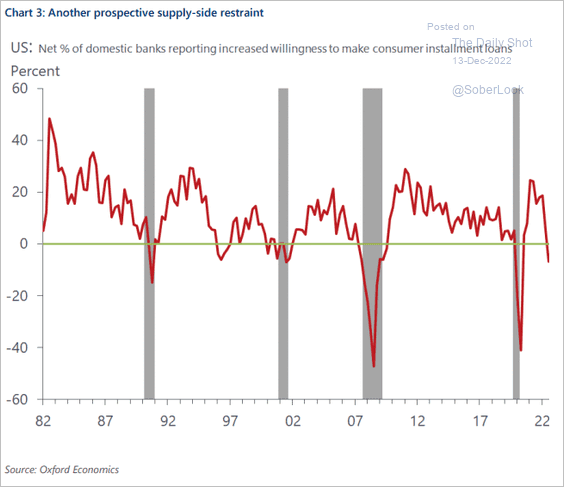
The Daily Shot (used with permission)
In addition, real GDP was negative in Q1 and Q2 2022 at -0.41% and -0.14%, respectively. Q3 2022 was strongly positive at 0.72% but it’s common for real GDP to fluctuate through recession. For example, in 2001 real GDP went -0.32%, 0.62%, -0.4%, and 0.28% for Q1-Q4. The S&P 500 didn’t bottom until October 2002.
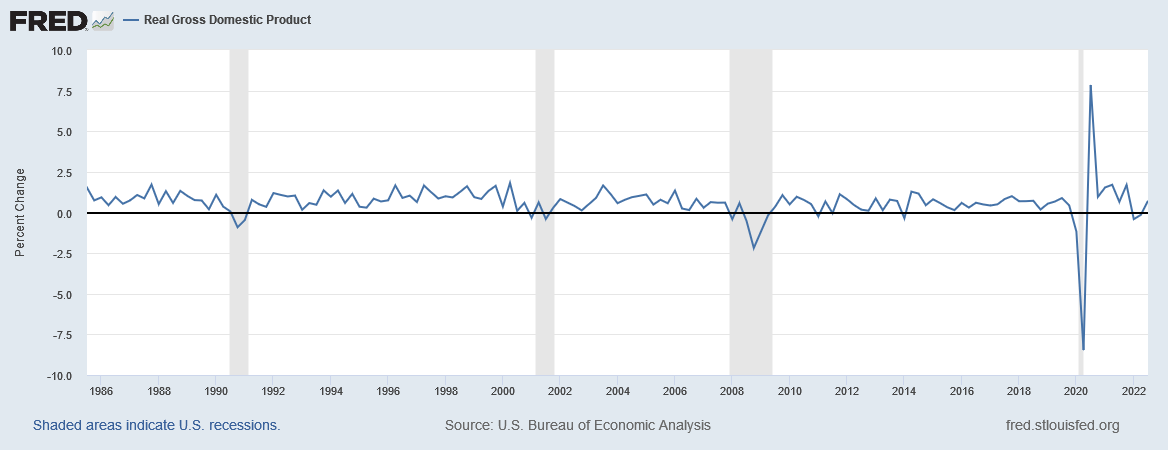
Federal Reserve Economic Data | FRED | St. Louis Fed
The Morgan Stanley Leading Earnings Indicator model is suggesting that S&P 500 earnings is set to decline by as much as 10% in 2023. I think that economic indicators will continue to degrade as the full effect of tightening monetary policy comes into effect, thus adjusting this forecast lower. Perhaps to -15%.
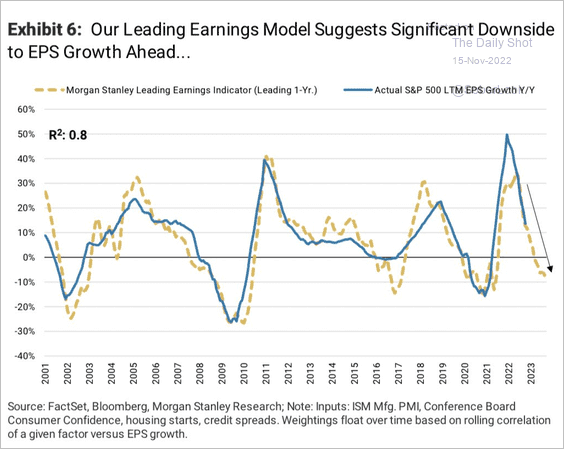
The Daily Shot (used with permission)
Market participants seem to be convinced that once the Fed pivots and injects monetary stimulus into the…
Read More: S&P 500: Recession Is Not Bullish, Predicting Index At 3,202 At End Of 2023


