


The Market
Let’s step back for a few minutes and look at the chart of the S&P 500 since March of last
year. We all know about the big downtrend but do you also realize that we’ve spent a lot
of time going sideways since May?
We had the big spring decline in April, a low in June, rally in the summer, a low in the
fall and now another decline. You might recall months ago I explained how bear markets
tend to decline and then stabilize, going in a sideways pattern, often for months, while
the market does its best to figure out if it is going to gear up and rally again or if it
is going to take another leg lower.

I also noted I did not expect this decline off the Thanksgiving overbought readings to
develop the same way the August one did. But now I step back and see that this decline is
quite different than the April and the August decline.
Notice those two declines were markets that made a high and then just turned south. This
time we pretty much stalled out and milled around at the highs for nearly a month before
coming down. And once we started down while it feels like we’ve been down for weeks, it
was basically one week of selling and then stabilization.
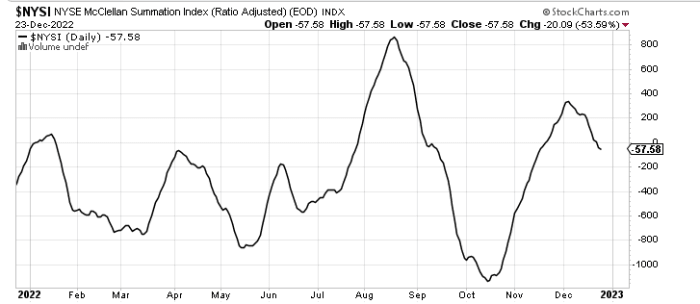
Even if you look at the McClellan Summation Index you can see how fast it turned down in
August and barely had a breather in early September, despite a 200 points S&P rally. Now
we’ve had a 300 point decline in the S&P and it’s come down quite gradually.
My take is that we are still in that period of the market cycle where the market is trying
to figure out if it is going to break down or up. Or continue the sideways action. It is
pretty clear to me that the majority believe we will break down or at best go sideways.
That means the contrarian in me wants to look at the market with a more bullish eye.
Naturally I turn to the indicators which are not confirming anything!
Shorter term I think even if we back off Tuesday and/or Wednesday we’d end up rallying
again into the end of the year and possibly even the first few days of the new year but
after that it gets murky again. And if we do rally this week the set up is for us to head
back down again in early January. And that is consensus, something I struggle with.
Short term, we’re still oversold enough to rally some more. I would not consider the
oversold condition to be great. Intermediate term we’re not oversold. If we don’t rally
this coming week then it is possible I can make the case for a better oversold condition
in mid to late January.
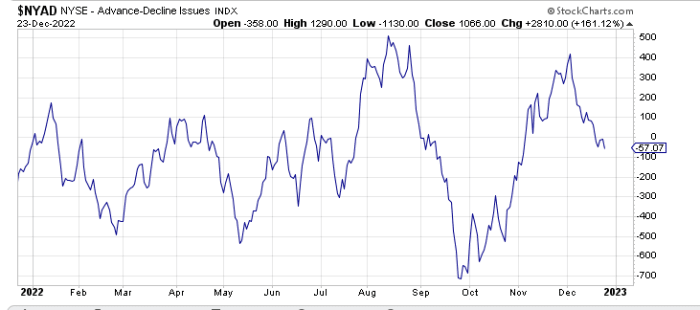
The aforementioned Summation Index is heading down but only needs a net +1,100 advancers
minus decliners on the New York Stock Exchange to halt the decline, so it’s within
spitting distance of doing so.
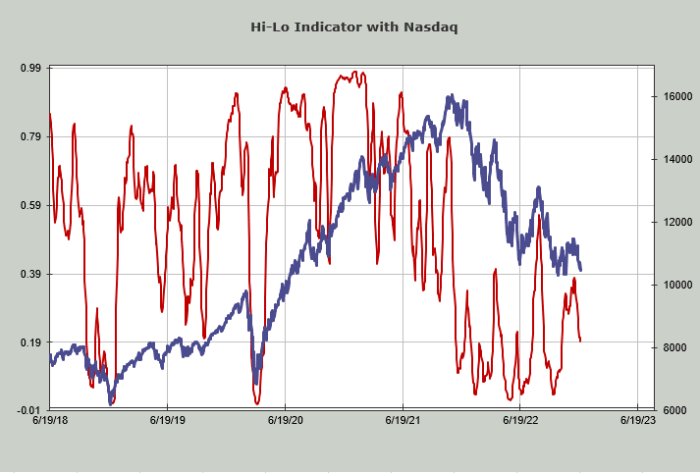
The Hi-Lo Indicator for Nasdaq is at 0.19. The NYSE is at 0.29. So Nasdaq is a touch
oversold while the NYSE is not there yet. The chart is shown below.
The Volume Indicator is at 48%. That basically says if the market is down in the next few
weeks it will get to an oversold reading, but right now it’s in no-man’s land.
Sentiment is mixed too. Sure the majority think we come down in January (I cringe since I
do as well) but overall, indicator wise, the Investors Intelligence readings are neutral
(we will not get another reading until the new year), the National Association of Active
Investment Managers Exposure is neutral, and American Association of Individual Investors
is too bearish but they have been that way all year.
Can we rally enough this week to get folks to stop talking about a decline in January?
That might be the best set up, similar to the way the consensus was the market would rally
to 4,100 back in October. It did just that but once folks saw the Consumer Price Index
report, they decided we’d go higher.
When the indicators are mixed, it’s often a sure way to get chopped up in the market.
New Ideas
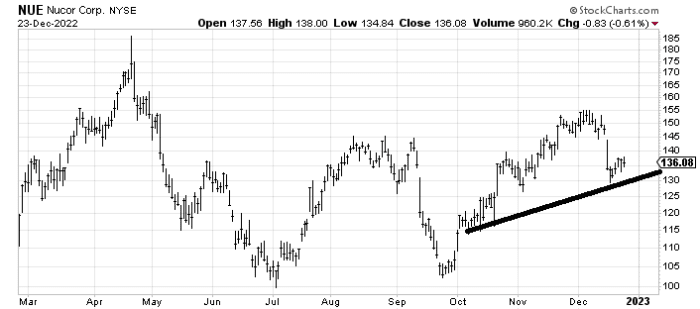
My inclination is to think if Nucor (NUE) – Get Free Report can rally to fill that gap at $145-$147,
I’d be a seller there. I just hope it rallies that far first before it comes down again.
Today’s Indicator
The Hi-Lo Indicator is discussed in full above. Here is Nasdaq’s.
Q&A/Reader’s Feedback
Helene welcomes your questions about Top Stocks and her charting
strategy and techniques. Please send an email directly to Helene with
your questions. However, please remember that TheStreet.com Top Stocks
is not intended to provide personalized investment advice. Email Helene
here.
We’ve got some interesting charts being asked about. I want to remind folks as we head
into the new year, do not hesitate to send your requests to me and I will do my best to
put them here in a timely fashion.
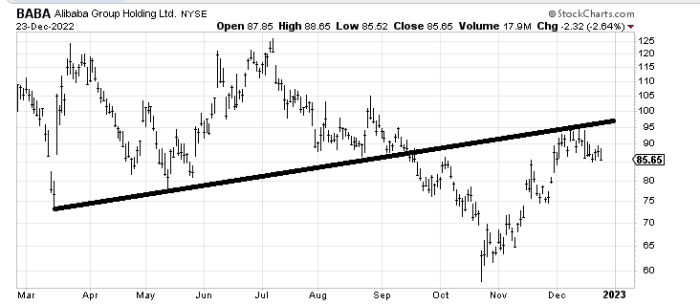
Alibaba (BABA) – Get Free Report might get interesting again on another trip down. If it can fill that
gap in the $75-$76 area, I’d take another look at it on the long side. Otherwise, there is
too much resistance overhead for me. It could use more work on the downside.
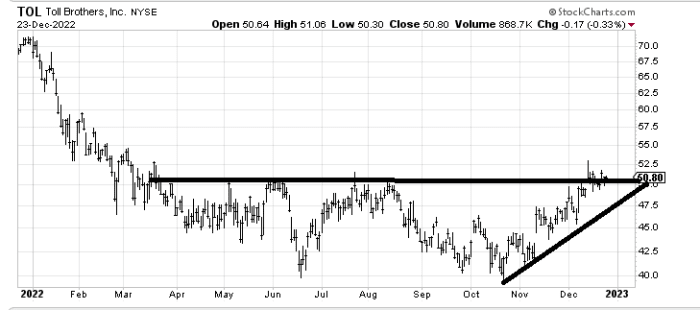
Toll Brothers (TOL) – Get Free Report is certainly trying to make a base. It’s impressive that with the
rise in rates last week it didn’t give much up. I wouldn’t chase it but I would like to
see it back at that uptrend line for a spot to buy it. In other words: it could use some
more downside work (a common theme)
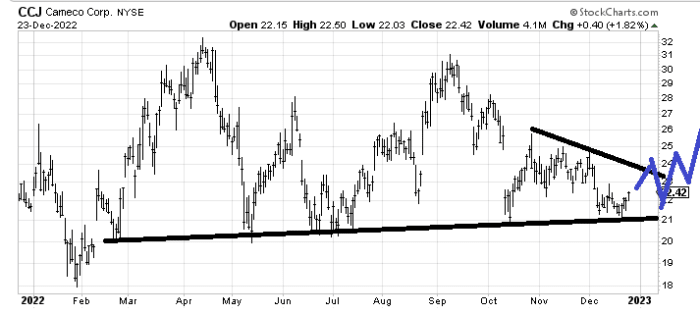
Cameco (CCJ) – Get Free Report looks to me like a stock trying to make a bottom but it’s early. I’d
like to see it – over the next few months — work its way sideways and hold this $20-$21
area while it slowly chews through resistance. I’ve drawn in blue how I would like to see
it map out. Remember it’s the pattern not necessarily the price.
Read More: Market Deciding Whether to Break Up or Down


