


guvendemir/E+ via Getty Images
The battered gold miners’ stocks are languishing deeply out of favor again, drifting listlessly through their summer doldrums. They were flying high a couple months earlier, before being crushed by a big-and-fast gold plunge. But the heavy gold-futures selling driving that has passed, leaving speculators’ positioning very bullish for gold. They will soon buy back in to normalize their bets, fueling a big gold and gold stock ramp up.
Traders are a myopic what-have-you-done-for-me-lately lot, endlessly chasing short-term momentum. Fixated on whatever is happening immediately, they quickly lose essential perspective on broader trends. They tend to extrapolate current conditions out into infinity, expecting them to continue indefinitely. So the recent tough bearish gold stock action has relegated this small contrarian sector back to pariah status.
Between mid-April to mid-May, gold stocks’ leading benchmark the GDX VanEck Gold Miners ETF (GDX) just collapsed 26.2% in 0.8 months! That brutal plunge culminated in a capitulatory mass-stopping, ravaging sentiment. All bullishness was obliterated, displaced by overwhelming universal pessimism. Weak price action over the following month didn’t help. After a bounce fizzled, GDX slumped another 1.6% into mid-June.
That marginal new low last week extended gold stocks’ total correction to 27.3% over 1.9 months. Now traders are mostly convinced this sector is doomed to grind considerably lower. But herd psychology is always wrong near inflections, when short-term trends reverse. Once gold futures buying returns, driving gold and its miners’ stocks higher, big gains rapidly accrue. The last truncated gold stock upleg showed that.
Between late January to mid-April, GDX blasted 39.5% higher in just 2.6 months! As it forged ahead over $40 just a couple months ago to achieve gold stocks’ best levels in 17.4 months, bullishness was building on this high-flying sector. But all that was smashed when an anomalous monster parabolic US-dollar surge erupted on extreme Fed hawkishness. That spawned heavy gold futures selling, bludgeoning gold stocks.
This sector’s roller-coaster ride in 2022 is readily evident in this longer-term GDX chart. Gold stocks have rapidly fallen from grace since mid-April, leading to their current bombed-out technicals. But recent $30ish levels have proven strong support since September 2021. The major gold stocks dominating this ETF have bounced near these levels five times since. A sixth is highly-likely given today’s gold futures setup.
Gold-Stock Technicals 2020 – 2022 (ZealLLC.com)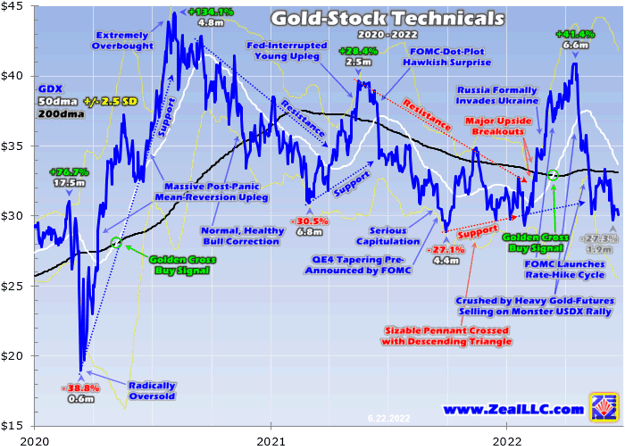
Before the Fed’s most-hawkish pivot ever launched the US dollar stratospheric, GDX’s young upleg this year was growing impressive. Even after gold’s Russia-invading-Ukraine geopolitical spike peaked at very-overbought levels in early March, the gold stocks kept marching higher on balance. Their own crest wasn’t seen until almost six weeks later in mid-April, when that heavy gold-futures selling suddenly flared.
As I analyzed in my essay last week on this topping dollar being gold-bullish, the US Dollar Index soared on extreme Fed hawkishness. Top Fed officials were aggressively jawboning about really accelerating their new rate-hike cycle, with bigger 50-basis-point hikes at coming Federal Open Market Committee meetings. They were also laying out plans for big quantitative tightening bond selling at unprecedented levels.
Over three FOMC meetings starting in mid-March, Fed officials hiked their federal funds rate by 25bp, 50bp, and 75bp! Early May’s 50bp hike was the first since May 2000, while last week’s massive 75bp beast was the first since November 1994! At both recent meetings the Fed chair himself said more 50bp hikes are very likely at coming meetings, resulting in much higher US-dollar yields, which drove a stampede into it.
And in early May, the FOMC also laid out its aggressive QT2 plans to start unwinding QE4’s ludicrous $5,016b of money printing. QT2 would start in June with $47.5b of monthly bond runoffs, then double just three months later in September to a $95b-per-month terminal pace! That dwarfs QT1, which ramped way slower taking an entire year to reach $50b monthly. Monetary destruction on QT2’s scale is unprecedented!
The Fed has never before lurched so hawkish so fast in its entire 109-year history. That catapulted the US dollar vertical, unleashing withering gold futures selling. That hammered gold 8.4% lower from mid-April to mid-May, directly driving GDX’s ugly 26.2% parallel plummeting. But speculators puking out massive amounts of gold futures has exhausted their capital firepower available for selling, which is very bullish for gold.
This next gold futures positioning chart was analyzed in depth in last week’s essay on the dollar and gold. But it is equally as important for gold stocks’ fortunes. Speculators’ total gold futures contracts on both the long and short sides are published weekly in the famous Commitments of Traders reports. They have returned to excessively-bearish levels that birth major gold uplegs. Gold stocks will amplify gold’s coming gains.
Speculator Gold Futures 2020 – 2022 (ZealLLC.com)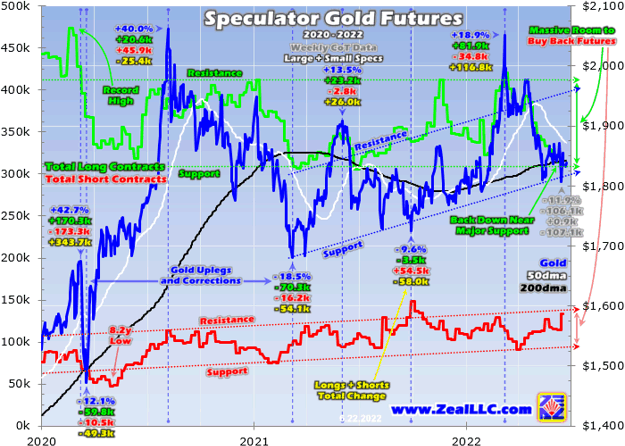
Specs’ total gold futures longs and shorts in recent years are rendered in green and red here. They are both trending in ranges, a wide consolidation for longs and a modest uptrend for shorts. Since mid-April when the US Dollar Index started shooting parabolic, speculators have done huge gold futures selling! The green longs line has collapsed to major support, while the red shorts line surged near major resistance.
CoT weeks are reported current to Tuesday closes, and there’s a five-CoT-week span from mid-April to mid-May that encompasses those brutal 8.4% and 26.2% plunges in gold and GDX. Specs jettisoned 59.8k gold-futures long contracts during that month-plus, while adding another 21.4k short ones. That added up to the equivalent of 252.6 metric tons of gold spewed into global markets during that brief timeframe!
That was way too much too fast to absorb, so gold plunged dragging the gold stocks down with it. The reason both gold’s and GDX’s bounces since mid-May failed is this gold futures selling moderated but persisted. In the four reported CoT weeks since then, specs dumped another 21.3k longs and sold 7.0k more shorts. That made for more gold-equivalent selling of 88.1t during this past month, keeping gold down.
During the nine reported CoT weeks since mid-April when gold was up over $1,975 and GDX neared $41, speculators’ gold-futures gold-equivalent selling ran -39.1t, -81.6t, -54.3t, -12.7t, -64.9t, +15.8t, -37.0t, -0.5t, and -66.3t! That’s a lot of gold vomited into world markets in a short span of time, fully explaining why gold and its miners’ stocks corrected hard. But all this selling paved the way for big mean-reversion buying.
Gold’s recent improving price action relative to the USDX proves specs’ gold futures selling is mostly exhausted. From mid-April to mid-May, this leading US-dollar benchmark skyrocketed 4.9% higher! That is a blistering monster rally for the world’s reserve currency, which usually meanders at a glacial pace. During that span, gold lost 7.8% on heavy gold futures selling which blasted GDX a brutal 25.9% lower.
While the extraordinarily overbought USDX retreated after that shocking parabolic surge, big dollar buying reignited in early June. That was leading into another red-hot CPI headline inflation report, and fears the FOMC would abandon its earlier forward guidance for mid-June’s meeting for a 50bp hike in favor of that huge 75bp one. So in just over a couple weeks, the USDX blasted up 3.8% to a lofty 19.5-year secular high!
That latest monster dollar surge was even more intense, averaging daily gains of 0.34% which were much faster than the 0.25% from mid-April to mid-May! Yet with speculators running out of gold futures selling firepower after that earlier dump, gold only fell a much milder 2.5% in early June. GDX amplified that to a much-smaller 8.6% loss. Again that compared to -7.8% for gold and -25.9% for gold stocks into mid-May.
So the yellow metal and its miners’ stocks have shown way more relative strength against this incredibly strong dollar in recent weeks. That’s because spec gold futures selling is rapidly exhausting. These hyper-leveraged traders have dumped about as many gold contracts as they can. Back to the spec-longs trading range in this chart, major support is near 312k contracts. Last Tuesday total spec longs hit 312.3k!
That’s the latest available CoT data when this essay was published, as CoT reports current to Tuesdays aren’t released until late Friday afternoons. Spec longs are unlikely to head much lower, as the traders willing to sell gold futures are mostly out based on this multi-year trend. Total spec shorts were running way up at 133.8k contracts last Tuesday, nearing the 138k upper-resistance line of their own multi-year uptrend.
So speculators’ available capital firepower to keep dumping gold futures longs and adding shorts looks to be mostly spent. I analyze specs’ overall gold futures positioning each week in our popular newsletters, to help game high probability for success gold stock trade entries and exits. An indicator recasts this CoT data into past year trading range terms, looking at spec longs and shorts compared to their 52-week trends.
The latest-available CoT had June-14th data, the eve of that last FOMC meeting with that huge 75bp rate hike. Total spec longs were running just 6% up into their past-year trading range, while total spec shorts were fully 75% up into their own! That was nearing the most bullish possible short-term setup for gold, which is 0% longs and 100% shorts. With longs sold out and shorts maxed, that leaves room for nothing but buying.
And since total spec longs outnumbered their shorts by 2.3x, they are proportionally more important for the coming price action in gold and gold stocks. Likely within…
Read More: Gold-Stock Futures Ramp Nears


