


The Market
We got the bond rally. And the stock rally. And the dollar decline. It was like a
trifecta.
So, how did the statistics look?
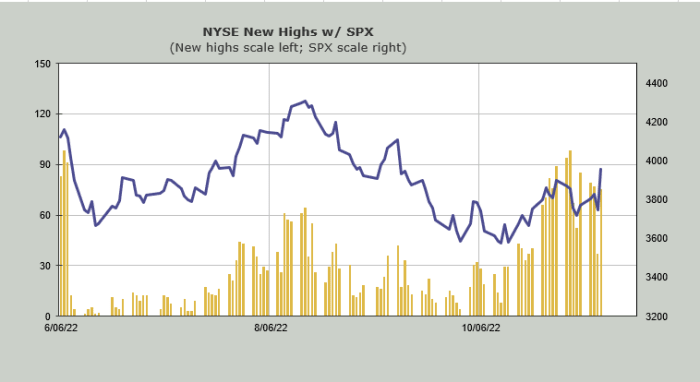
Since we’ve been discussing the new highs lately, let me report that the New York Stock
Exchange lagged considerably. The peak reading so far was 98 in early November. Today was
75.
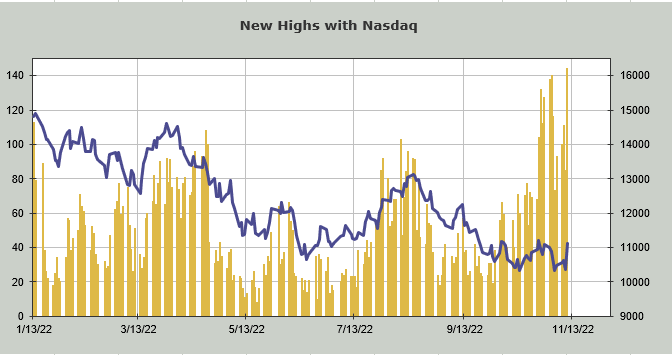
Yet, Nasdaq which had 140 in early November, today had 144 new highs. What is even more
interesting is that the S&P is higher than it was in early November (what I match the NYSE
new highs against) and Nasdaq is still lower.
The Hi-Lo Indicators, however, did not flip back up, not for the NYSE nor for Nasdaq.
Breadth was good, but then again it has been good. Remember, the Rocky analogy from a few
nights ago? When I said breadth was pushing along — not leading or lagging — looking a
bit like in the first “Rocky” movie when Rocky would run and Paulie would drive in the car
along side him, just chugging along. That analogy remains in place. Yet for a day the
market was so strong in the indexes, the NYSE had a mere 87% of the volume on the upside.
That goes on the negative side of the ledger.
Nasdaq had 90% of the volume on the upside.
That tells me that my thesis that if we got a bond rally that folks would rush to tech was
correct. Notice that the Russell 2000 is only back to where it was a week or so ago, which
also happens to be its 200-day moving average line. I think folks were short or under
exposed to the market and they had to chase and the easiest way to get exposure is those
big-cap tech stocks.
This leaves us with many charts at resistance and the indicators still showing the window
is open for a rally, even if we get more chop and more volatility. I think Friday is a
wild card, because the bond market is closed for Veteran’s Day, but I’m still eyeing
sometime around Thanksgiving as the point we get back to an intermediate-term overbought
condition.
New Ideas
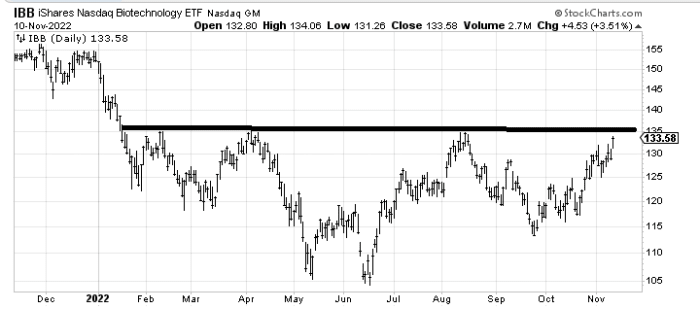
We have been looking at the fund for biotechs (XBI) – Get Free Report and it has been rather
lackluster, so instead I wanted to show you the chart of another fund (IBB) – Get Free Report, which
has a clear-cut breakout if it gets over $135. I expect it makes a stab at getting over it
sometime next week.
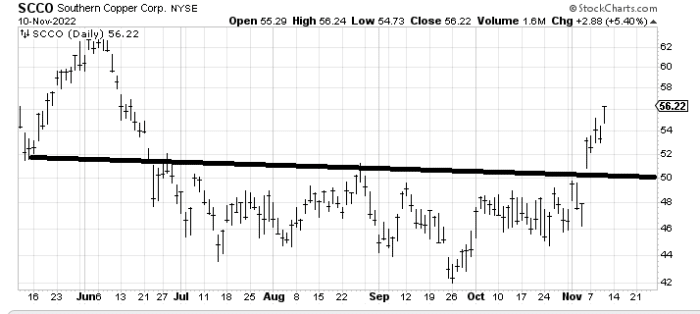
Southern Copper (SCCO) – Get Free Report has been terrific, but that base measures to $56-$58, so I
think it’s wise to take a little something off the table here.
Today’s Indicator
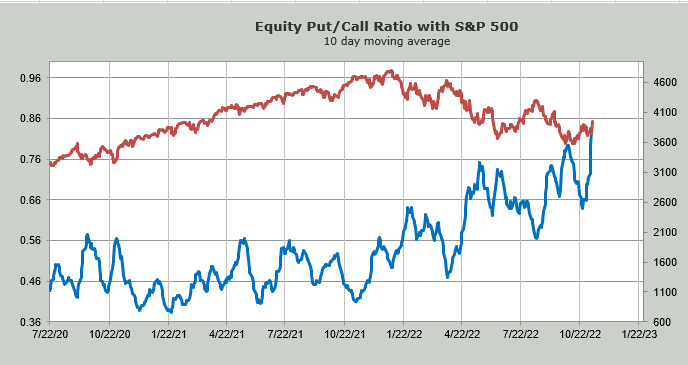
The 10-day moving average of the equity put/call ratio is the highest it has been since
March 2020, thanks to some very high readings earlier this week. This is helpful for the
bull case.
Q&A/Reader’s Feedback
Helene welcomes your questions about Top Stocks and her charting strategy and
techniques. Please send an email directly to Helene with your questions. However, please
remember that TheStreet.com Top Stocks is not intended to provide personalized investment
advice. Email Helene here.
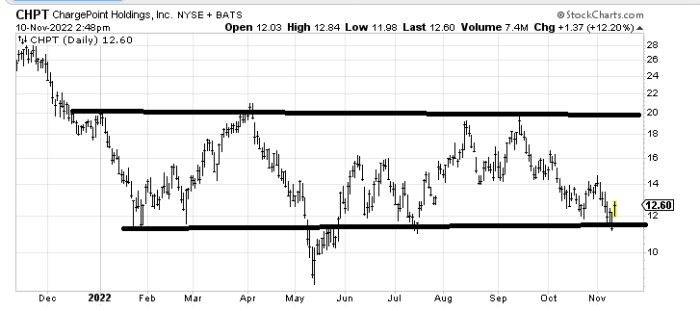
When we last looked at ChargePoint (CHPT) – Get Free Report near the October lows, I was a seller near
$14. Now I will take a different view. If the lows of a few days ago ($11 area) can hold
then maybe the cart is just in a giant trading range. If it breaks $11, I’d get out fast.
If it can’t crack over $14 I’d get out, too.
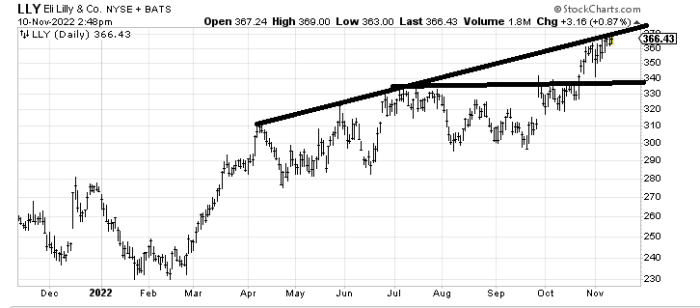
Eli Lilly (LLY) – Get Free Report has been terrific. It has some resistance here from the line and a
measured target around $380, so I’d be inclined to take some profits if it gets into that
$380 area.
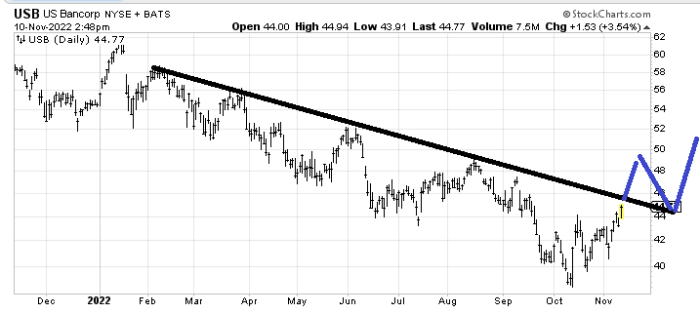
When we looked at US Bancorp (USB) – Get Free Report a few weeks ago, I thought it was OK, without
being special, because of all the resistance overhead. I still feel the resistance is
going to take time and effort to eat through, starting with the downtrend line at
$45.50-$46. The chart needs more developing if it is going to get me more interested. For
example if it mapped out as I have drawn in blue, then I would warm up to it.
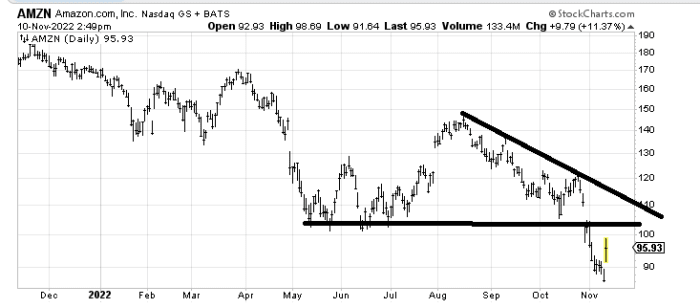
I don’t love the chart of Amazon (AMZN) – Get Free Report for obvious reasons. I am a seller in the
$105-$110 area.
Read More: Markets Pack a Punch


