


Note: Meisler will be away for two weeks and will have limited access to email. The next
edition of Top Stocks will be Jan. 29.
Since I will be out of touch for the next two weeks, I’m going to begin with what you
already know and then what you want to look for as the weeks progress.
We already know that we are now overbought. Oh, sure, I can couch it to sometime between
Friday and Wednesday (remember, Monday is a holiday), but take a look at my own Oscillator
and you can see it is stretching almost off the chart at the top, similar to the way it
stretched off the bottom in late September — yes, notice I say late September. We got
oversold in late September, rallied and came back down. When we came down again in mid-
October, the Oscillator was already much higher than the prior low (a positive divergence).
This time we should see a similar situation: A back off and another rally.
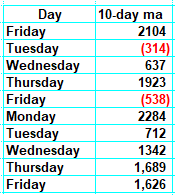
This indicator is based on the 10-day moving average of net breadth. I look back at the
numbers we are dropping to see if we are overbought or oversold. Beginning Friday, eight of
the next 10 days we are dropping positive breadth numbers, which is what makes us
overbought.
The McClellan Summation Index is still rising (bullish), because breadth is still quite
positive (bullish), but what it will take to halt the rise is a net differential of
negative 5,300 on the New York Stock Exchange (advancers minus decliners), so we know it is
overbought when we would need two days of net breadth negative 2,700 just to stop the rise.
Then there is the Daily Sentiment Index for the Volatility Index, which is now at 12. The
last time it got this low, it was at 9, and that was the first week of November 2021. I
would not equate this period with that one. Then we had poor breadth and fewer new highs,
which is not the case now. But it still says we’re overbought and we should expect some
corrective action next week.
Everyone will be watching the big downtrend line on the S&P. Quite frankly, I don’t much
care if we cross it or not, nor do I care if we cross the 200-day moving average. I care
about the indicators. If we cross them and new highs contract and breadth turns sour, then
I will be bearish. So, keep your eyes on stocks making new highs and breadth. The NYSE
needs to see more than 110 new highs. If it falls under 100 while the market is still
rising, that is a negative.
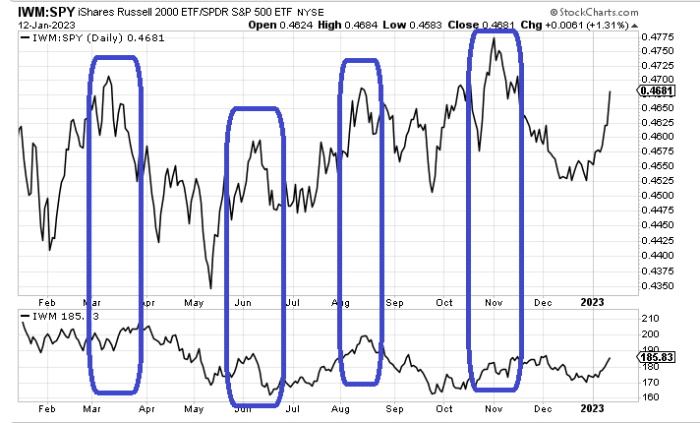
Also, keep your eyes on the ratio of Russell 2000 exchange-traded fund (IWM) – Get Free Report to the
S&P 500’s fund (SPY) – Get Free Report. The small caps have been rocking compared to the large caps, as
you can see. This is the inverse of what happened in November. So watch this ratio for
signs of peaking. A peak in the ratio typically portends a bigger move down in the market.
Sometimes it lines up perfectly, sometimes it takes a few weeks but you can see once this
ratio stops going up, the market tends to be much more difficult.
Other things to watch: The dollar broke down today, but the DSI on it is now 19. It might
have some more downside ahead of it, but that downside will be limited, because as the
dollar falls, so does the DSI. And a rising dollar will be problematic for stocks.
Lastly, the DSI for gold is now at 90. Copper is at 88. The charts are fine, but I cannot
sanction getting on board with the sentiment where it is. I’m in the camp that says take
something off the table.
New Ideas
I am going to refrain from any new ideas, because the market is overbought and I will be
away, but I do want to note that Cleveland-Cliffs (CLF) – Get Free Report tagged that first target of
$20 today on a Morgan Stanley upgrade.
Speaking of Morgan Stanley (MS) – Get Free Report, it tagged my first target of $90 today. Earnings are
Tuesday.
Today’s Indicator
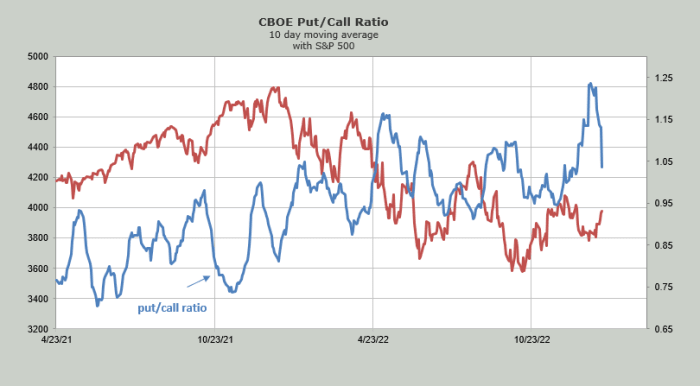
I have not been using the put/call ratio, since I sensed it had become corrupted. Since
late December, everyone seemed to notice it, and there were many articles written on why it
had become so wild. Since those articles appeared, we have not had any absurd readings and
none in 2023. With that as background and the fact that I’m still not sure about the
indicator, I want to show you how far the 10-day moving average has fallen, because this
may become relevant again in the weeks ahead.
Q&A/Reader’s Feedback
Helene welcomes your questions about Top Stocks and her charting strategy and
techniques. Please send an email directly to Helene with your questions. However, please
remember that TheStreet.com Top Stocks is not intended to provide personalized investment
advice. Email Helene here.
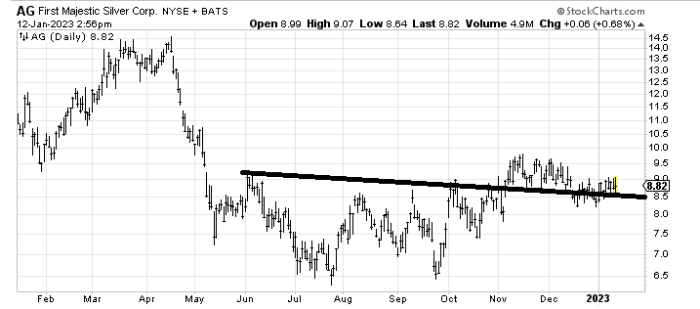
I don’t really understand why the traditional silver stocks have barely budged in this
move, but First Majestic (AG) – Get Free Report surely hasn’t gotten a lift. It probably needs some more
sideways work but as long as it stays over 8.30 it should get the benefit of the doubt. If
we do get a pullback next week as I expect and this stays over that level, then it might be
worth trying.
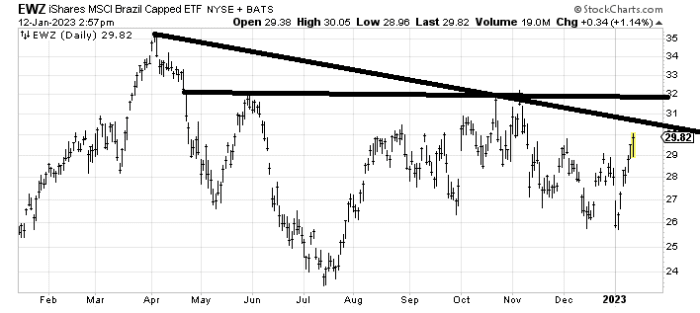
The IShares MSCI Brazil ETF (EWZ) – Get Free Report has moved up nicely, but it has resistance at
$30-$32. A dip back to $28-$29 would be helpful, but there is too much resistance in the
near term to get excited over it here. Keep in mind I still favor iShares MSCI Emerging
Markets ETF (EEM) – Get Free Report in general (since October).
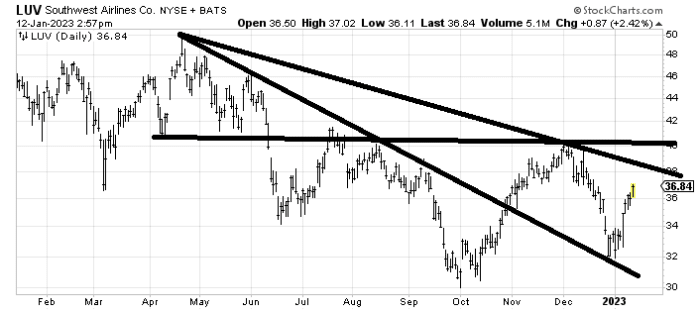
If Southwest Air (LUV) – Get Free Report can pull back to that $34 area, I would find it more
interesting to buy. Right here it runs smack into resistance at $37-$38.
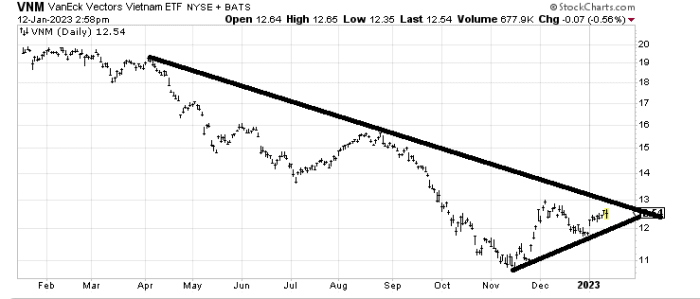
The way I see it, there are two choices on the VanEck Vietnam ETF (VNM) – Get Free Report an ETF for
Vietnam. You can buy here with a stop under $12 (that recent low) or you can see if it can
cross that downtrend line and then buy the retest. Right here I see an emerging market that
hasn’t made a higher high than December (when so many others have) but either way a break
of either of these lines and I’d go with it.
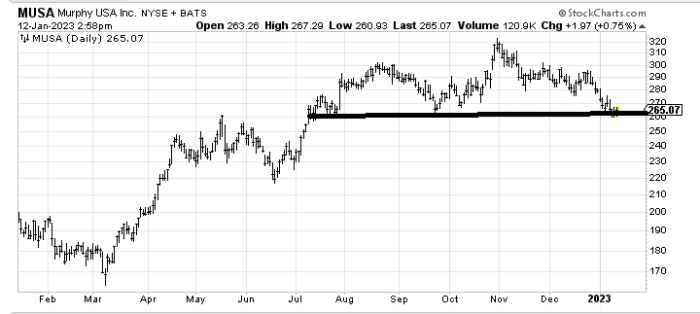
I don’t love the chart of Murphy USA (MUSA) – Get Free Report, but at least I know where I’m wrong if I
want to bottom fish it. Trade under $255 and it’s wrong to be long. If it does bounce, then
$280 is resistance.
Read More: What to Watch as We’re Overbought


