


Drew Angerer/Getty Images News
Investment Thesis
It is clear that Amazon (NASDAQ:AMZN) has experienced a revenue growth in all of its segments including online stores, physical stores, retail third-party seller services, subscription services, AWS, and other segments. Many analysts and investors suggest to buy more of its stock at the current price regardless of the prevailing market conditions. However, it has recently suffered from the deficiency of free cash flows, as well as an increase in downside volatility and tail risk. This will probably lead AMZN’s price to move lower in the mid-term future.
Investors’ Desire Towards Amazon
One of the first things that you might have heard about Amazon in recent time is that it has been scaling up its business by expanding more infrastructure and workforce. This is a plausible explanation for its weak capital structure and poor income that many Wall Street analysts have used to prove that Amazon is the best company and recommend investors to buy more at the current market price. I have conducted a survey and saw that many analysts and investors across several newspapers and trading & analytics platforms including Seeking Alpha are really bullish on AMZN through their articles and comments. This bullish sentiment may drive the price to go up further in a duration which is understandable for many reasons such as the impressive revenue growth and the dominance in the cloud industry.
Amazon Has Many Competitors
Although Amazon has partnerships with American Express and Synchrony, and will launch the first co-branded Visa credit card in 2022 with JP Morgan, it faces stiff competition in this space from Mastercard and Google. Amazon’s competitors in the segment of physical stores include Costco Wholesale and Barnes & Noble in addition to Walmart. While revenue from subscription services has gradually increased, Amazon is competing with popular video, music, and reading platforms such as Netflix, Disney, and iTunes.
Despite the fact that AWS and Microsoft Azure offer different products and customer segmentation, they are formidable competitors. While AWS focuses on open source, Azure does not and instead supports Windows. Many know that open source is the future of programming, but Microsoft has an abundance of talents, so this isn’t a big deal. After years of being dominated by AWS, the market share of AWS in the cloud industry is now hovering around 32%. Given Azure’s rapid growth, its market share has risen to around 22% in the last few years. Because Microsoft Azure’s annual growth rate is higher than that of AWS, Azure could be on par with AWS in the not-too-distant future.
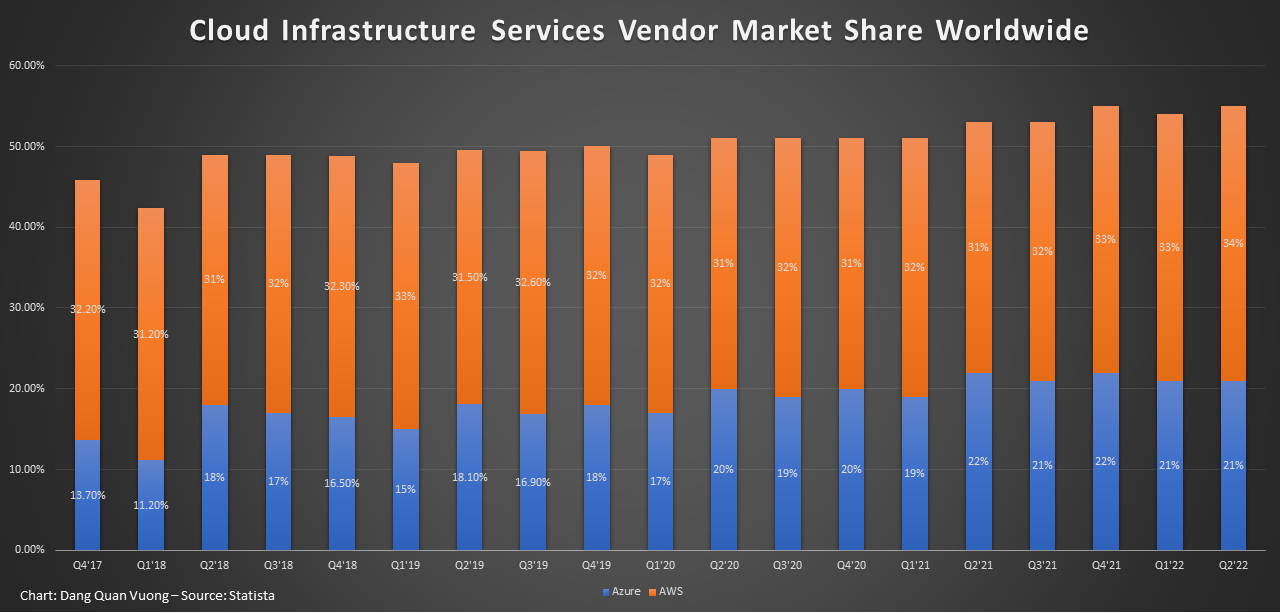
Cloud infrastructure services vendor market share worldwide from 4th quarter 2017 to 1st quarter 2022. (Statista)
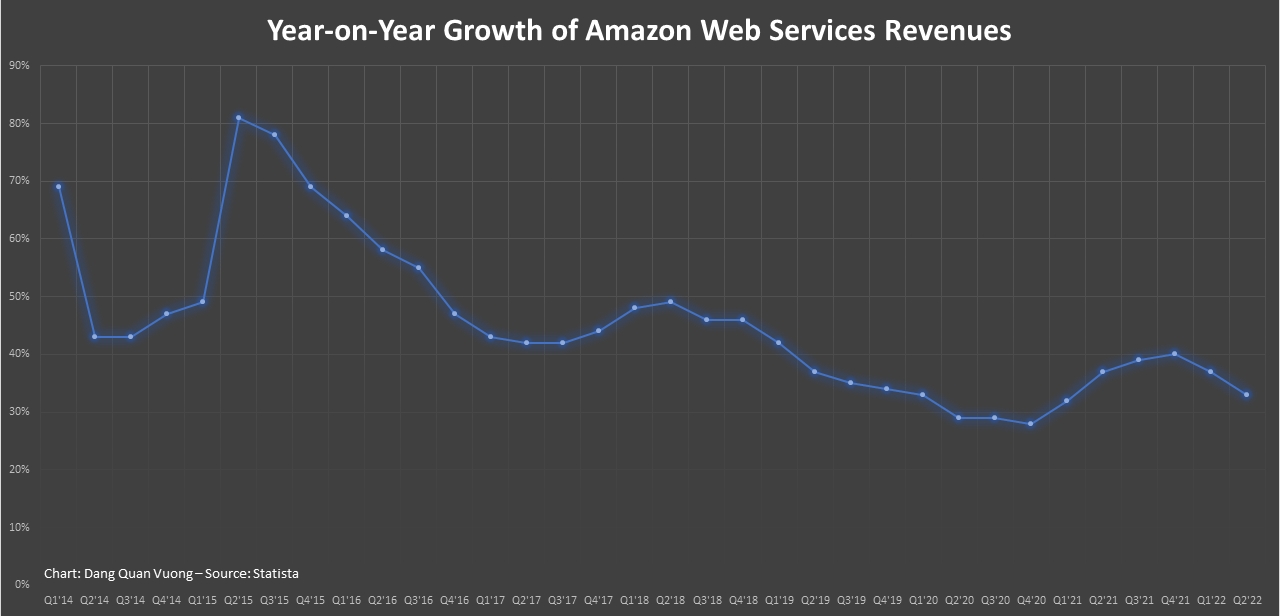
Year-on-year growth of Amazon Web Services revenues from 1st quarter 2014 to 1st quarter 2022. (Statista)
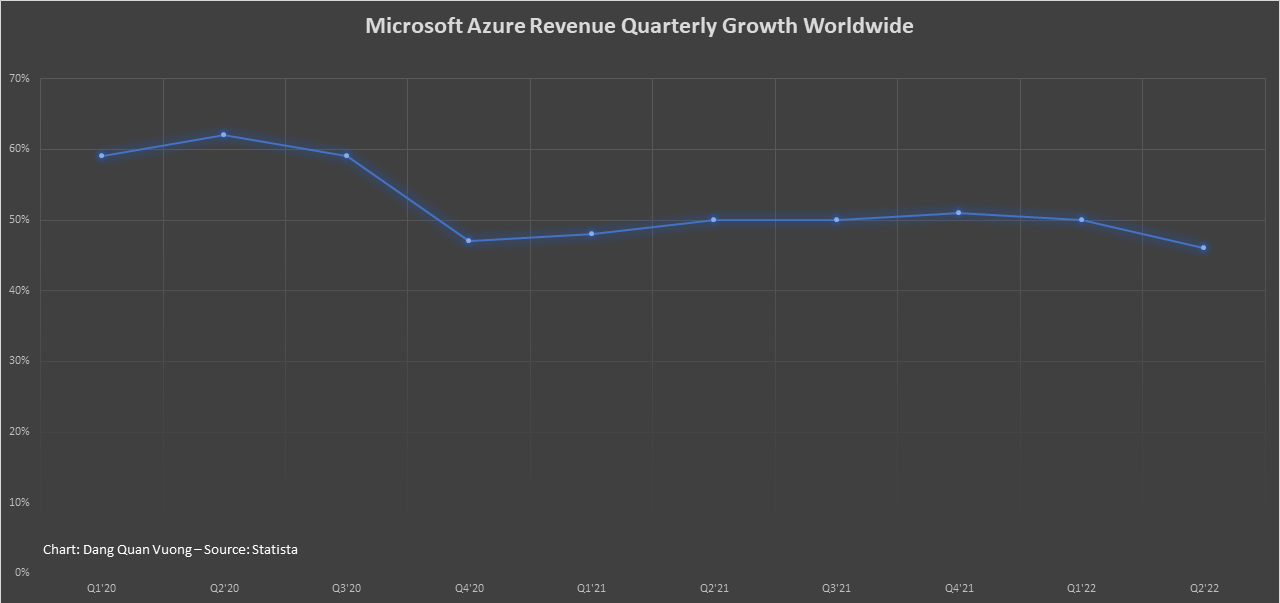
Microsoft Azure revenue growth worldwide from financial year 2020 to 2022, by quarter. (Statista)
While JD.com and Walmart support online stores selling products on e-commerce websites, third-party selling services like eBay, and Alibaba provide the best online marketplace for their vendors. Also, Chinese marketplace is the largest and most profitable one that all companies want to put their foot into. However, it may be challenging if Amazon wants to dominate the retail sector and profit on its own. Amazon must compete not only with eBay in the US market, but also with Alibaba if it is about to expand to the global market. In fact, it has had to shut down its China domestic e-commerce marketplace business in 2019 because of stiff competition from Chinese e-commerce giants including Alibaba and JD.com. Think about what happens if a company is no longer able to scale up its business? With only the US market, the spike of Amazon’s profit and income in 2020 during Covid lockdown is just because of the unusual increase in online consumption which is not cyclical. As a result, Amazon is facing the risk of a saturation point wherein it is not capable of generating more income as shown in the following sections.
Amazon’s Competitive Advantage Has Been Challenged
The unit used in the below table is in million dollars, except for free cash flow per share.
| Dec-12 | Dec-13 | Dec-14 | Dec-15 | Dec-16 | Dec-17 | Dec-18 | Dec-19 | Dec-20 | Dec-21 | TTM | |
| Gross Profit | 15,122.00 | 20,271.00 | 26,236.00 | 35,355.00 | 47,722.00 | 65,932.00 | 93,731.00 | 114,986.00 | 152,757.00 | 197,478.00 | 207,214.00 |
| Operating Income | 676 | 745 | 178 | 2,233.00 | 4,186.00 | 4,106.00 | 12,421.00 | 14,541.00 | 22,899.00 | 24,879.00 | 15,298.00 |
| Selling General & Admin Expenses | 9,723.00 | 12,847.00 | 16,650.00 | 20,411.00 | 27,284.00 | 38,992.00 | 52,177.00 | 64,313.00 | 87,193.00 | 116,485.00 | 130,152.00 |
| R&D Expenses | 4,564.00 | 6,565.00 | 9,275.00 | 12,540.00 | 16,085.00 | 22,620.00 | 28,837.00 | 35,931.00 | 42,740.00 | 56,052.00 | 61,412.00 |
| Capital Expenditure | -3,785.00 | -3,444.00 | -4,893.00 | -5,387.00 | -7,804.00 | -11,955.00 | -13,427.00 | -16,861.00 | -40,140.00 | -61,053.00 | -65,358.00 |
| Free Cash Flow / Share | $0.04 | $0.22 | $0.21 | $0.71 | $0.99 | $0.67 | $1.78 | $2.19 | $2.59 | ($1.46) | ($2.93) |
The thing may surprise shareholders is that Amazon’s gross profit of TTM 2022 was higher 4.93% YoY than that of fiscal 2021, while the operating income (TTM) declined -38.51% YoY at the same time. This is mostly attributed to the rate of change in sudden upsurge of selling general & admin expenses and R&D expenses relative to the gross profit. If we divide operating income by gross profit in the fiscal 2021 and TTM 2022, we can get the values at nearly 12.60% and 7.38%, respectively. Put simply, $100 gross profit can generate $12.60 operating income in fiscal 2021 while $100 gross profit can only generate $7.38 operating income in TTM 2022. In other words, the probability to convert its gross profit to operating income has reduced by about -41.42%, or Amazon needed much more cost to generate a similar amount of income in fist days of 2022.
It can be seen more clearly by the capital expenditure when cash outflows towards purchase of plant, property and equipment have surged dramatically. This budget has not been used efficiently as the free cash flow was negative in the fiscal 2021 for the first time after over ten years of growth. It was even worse in the first half of 2022 when the free cash flow was -$2.93 per share. As claimed by Amazon CFO Brian Olsavsky, the investment in too much warehouses and workforce compared to demand has resulted in lower productivity.
There is no doubt that AMZN is a growth stock over the last decade. However, the most important feature that new investors would like to see in a growth stock is that the company is experiencing the growth cycle instead of the stage of reinvesting to the new development. It may be healthy for the long-term growth, but would lead the company to short-term financial burdens, especially in the sensitive time when consumer price inflation has increased alongside the decrease in consumer confidence and income expectation. This will directly affect the market price of its shares, potentially resulting in short-term losses for many new buyers.
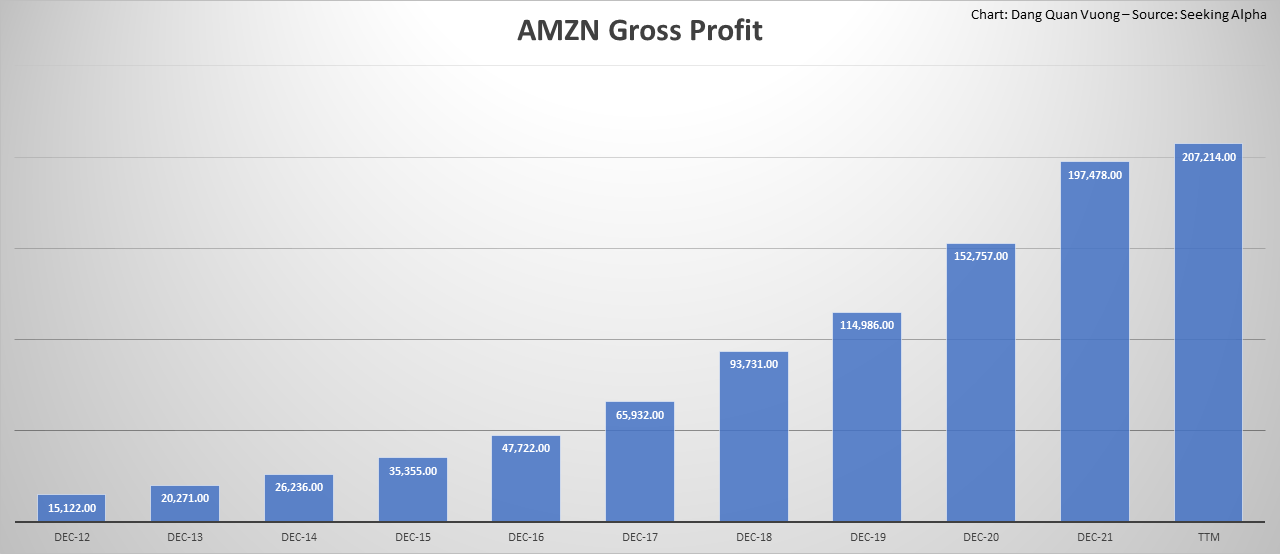
Amazon’s gross profit in million dollars has gradually increased. (Seeking Alpha)

The operating income (TTM) in million dollars declined in the first two quarters of 2022. (Seeking Alpha)
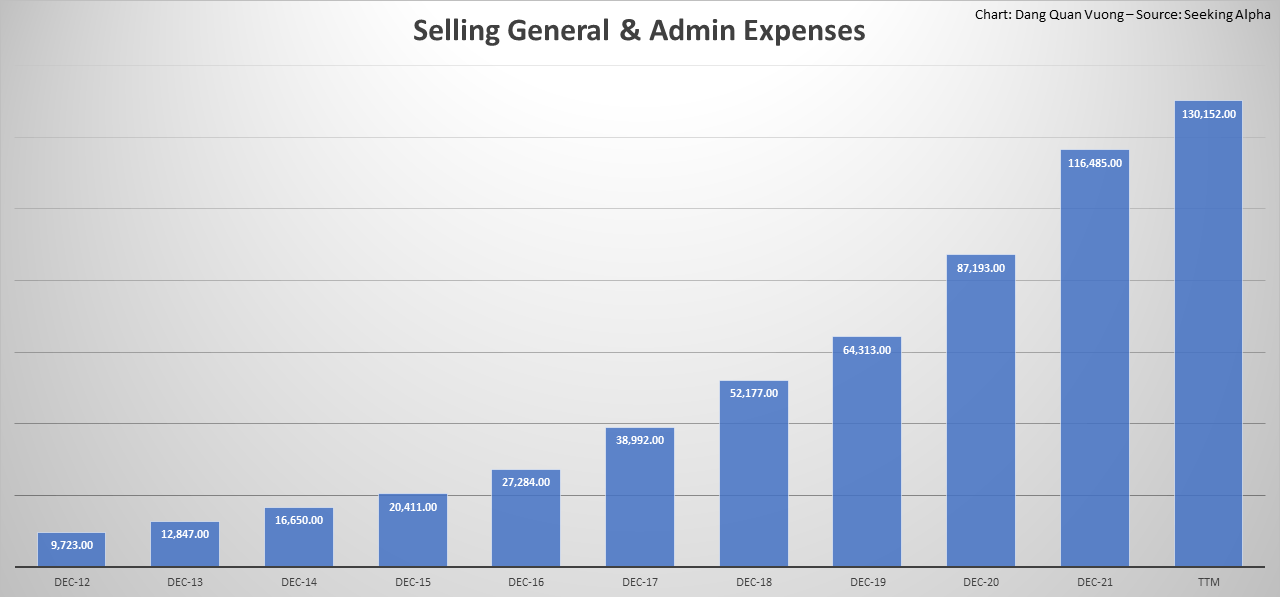
The sudden upsurge of selling general & admin expenses. (Seeking Alpha)
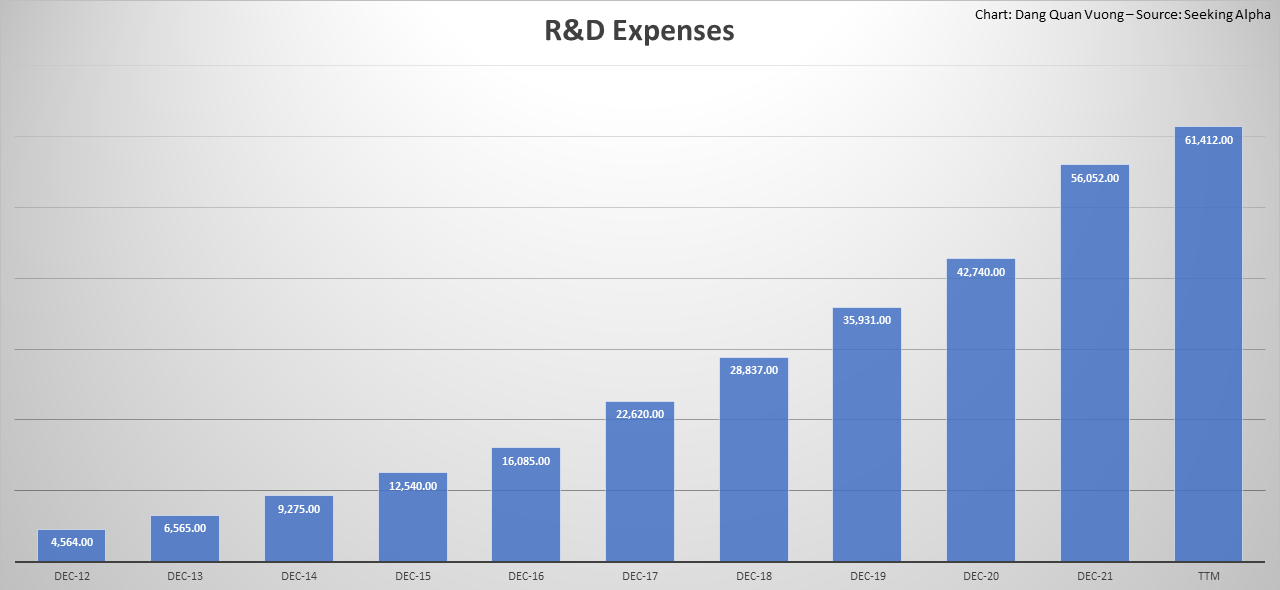
The sudden upsurge of R&D expenses. (Seeking Alpha)
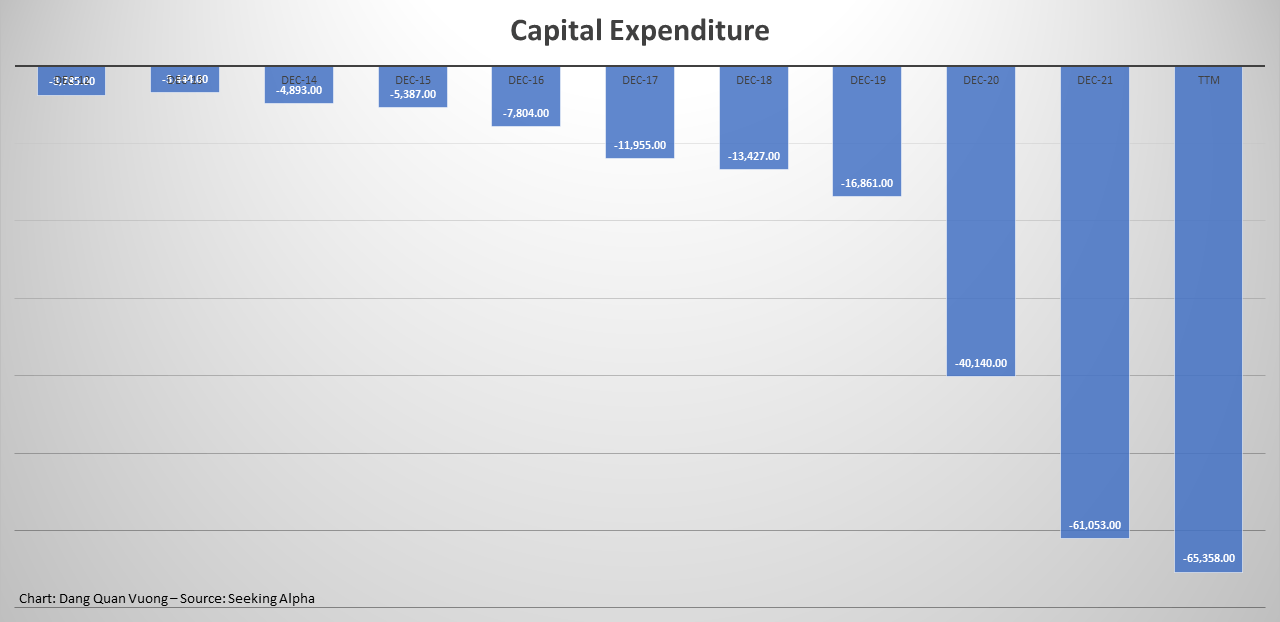
Cash outflows towards purchase of plant, property and equipment has surged dramatically. (Seeking Alpha)
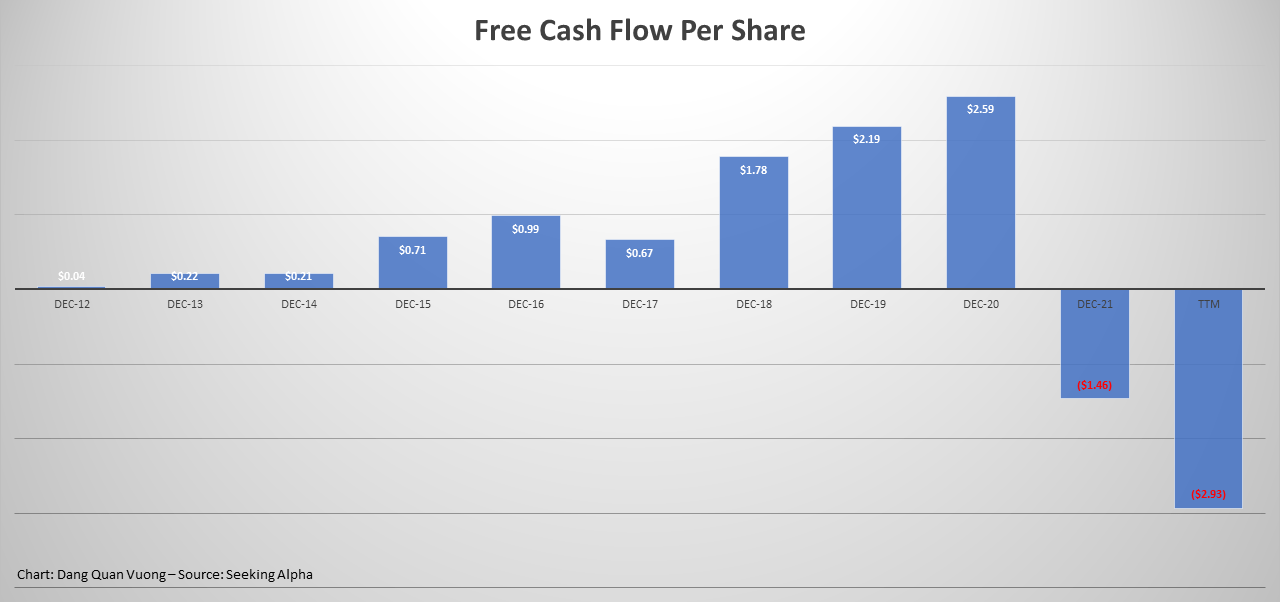
The free cash flow was negative after ten years of growth. (Seeking Alpha)
There May Be Problem in Short-term Debt
Surprisingly, Amazon’s net income dropped by roughly 65.21% from 33,364 million dollars in fiscal 2021 to 11,607 million dollars in TTM 2022, whereas gross profit increased by about 4.93% at the same time. Meanwhile, the total debt issued and total debt repaid have risen rapidly, mainly because an increasing amount of short-term debt has been issued and repaid suspiciously. This raised the question of liquidity which has not been cyclically seen in the past. Perhaps, Amazon is swayed by short-term financial obligations due to the lack of free cash flows.
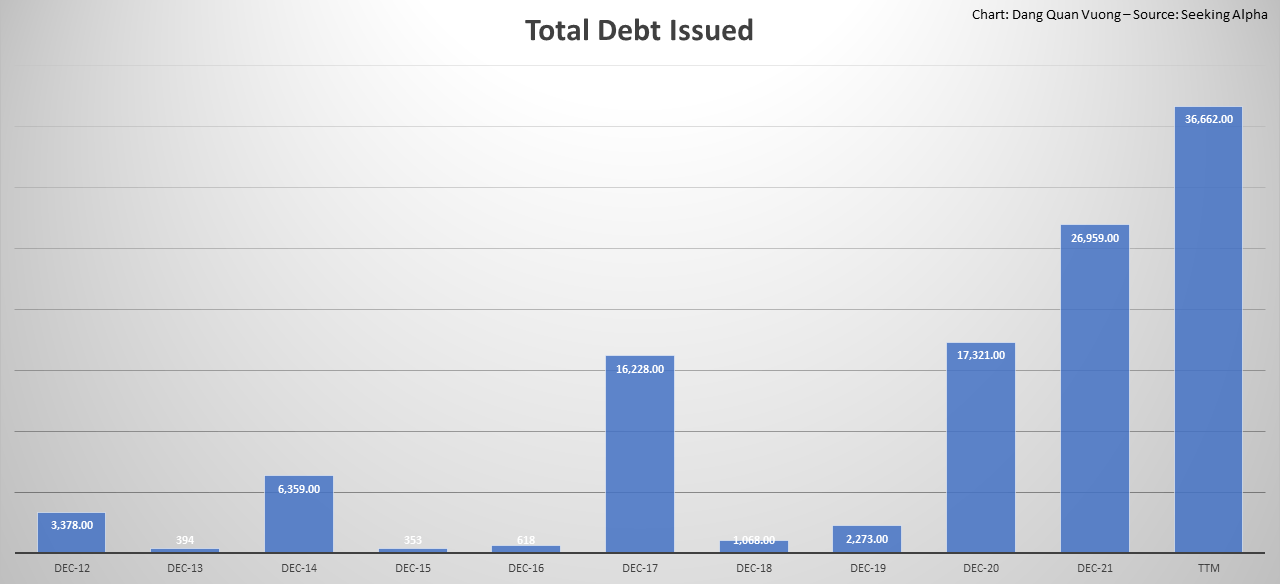
The total debt issued in million dollars has risen rapidly (Seeking Alpha)
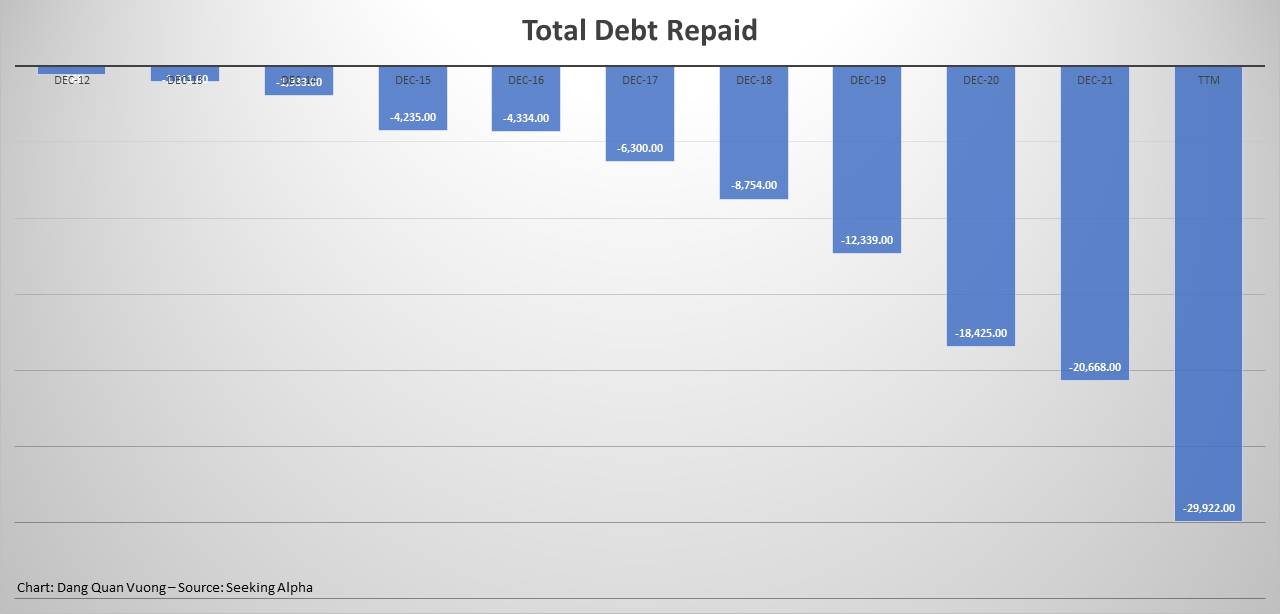
The total debt repaid in million dollars has risen rapidly. (Seeking Alpha)
The following tables use the unit of million dollars.
|
Dec-12 |
Dec-13 |
Dec-14 |
Dec-15 |
Dec-16 |
Dec-17 |
Dec-18 |
Dec-19 |
Dec-20 |
Dec-21 |
TTM |
|
| Total Debt Issued | 3,378.00 | 394 | 6,359.00 | 353 | 618 | 16,228.00 | 1,068.00 | 2,273.00 | 17,321.00 | 26,959.00 | 36,662.00 |
| Total Debt Repaid | -588 | -1,011.00 | -1,933.00 | -4,235.00 | -4,334.00 | -6,300.00 | -8,754.00 | -12,339.00 | -18,425.00 | -20,668.00 | -29,922.00 |
|
Dec-19 |
Mar-20 |
Jun-20 |
Sep-20 |
Dec-20 |
Mar-21 |
Jun-21 |
Sep-21 |
Dec-21 |
Mar-22 |
Jun-22 |
|
| Short-term Debt Issued | – | 617 | 2,433.00 | 1,311.00 | – | 1,926.00 | 1,176.00 | 2,187.00 | – | 13,743.00 | 4,865.00 |
| Long-term Debt Issued | – | 76 | 9,918.00 | – | – | 111 | 18,516.00 | 176 | – | – | 12,824.00 |
|
Dec-19 |
Mar-20 |
Jun-20 |
Sep-20 |
Dec-20 |
Mar-21 |
Jun-21 |
Sep-21 |
Dec-21 |
Mar-22 |
Jun-22 |
|
| Short-term Debt Repaid | – | -631 | -1,906.00 | -1,349.00 | – | -2,001.00 | -1,176.00 | -1,917.00 | – | -6,231.00 | -7,610.00 |
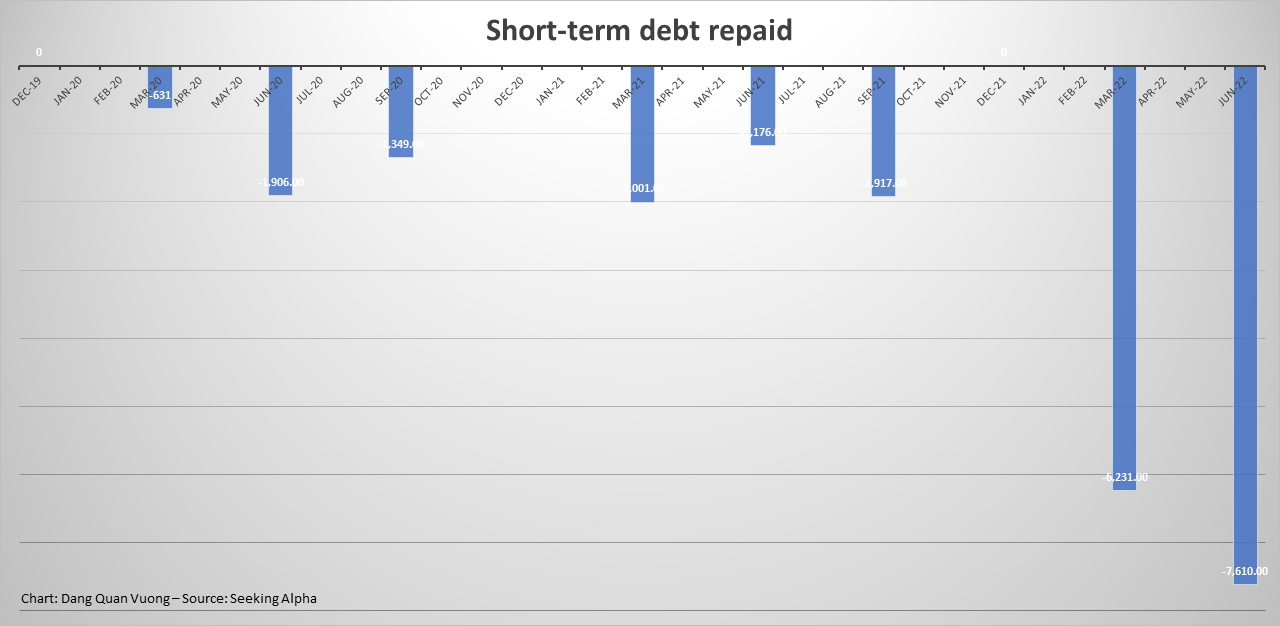
An increasing amount of short-term debt in million dollars has been issued and repaid suspiciously. (Seeking Alpha)
Liquidity and Working Capital Are Not Used Efficiently
The Debt/EBITDA ratio gauges the relativity between debt and earnings before interest, taxes, depreciation, and amortization expenses. This ratio indicates a company’s financial health and liquidity state by measuring its ability to repay incurred debt. Unfortunately, AMZN’s Debt/EBITDA ratio has increased by nearly 56.69% from 1.57 in fiscal 2021 to 2.46 in TTM 2022. It implies that the amount of debt relative to earnings is extremely high, and Amazon is less capable of effectively managing its debt.
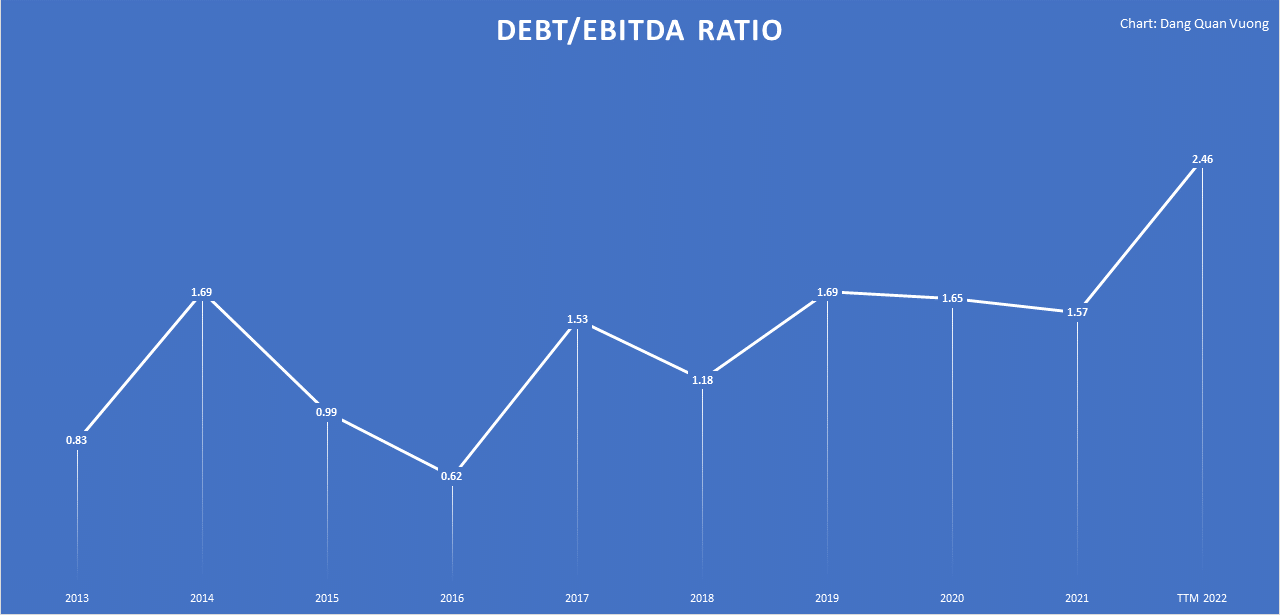
The company is less capable of effectively managing its…
Read More: Amazon: Sell; No Further Upside Potential For New Buyers (NASDAQ:AMZN)


